Quantcast
Channel: Journey Into Incident Response
Viewing all 102 articles
Browse latest View live

Ripping VSCs – Tracking User Activity

$
0
0
For the past few months I have been discussing a different approach to examining Volume Shadow Copies (VSCs). I’m referring to the approach as Ripping VSCs and the two different methods to implement the approach are the Practitioner and Developer Methods. The multipart Ripping VSCs series is outlined in the Introduction post. On Thursday (03/15/2012) I’m doing a presentation for a DFIROnline Meet-up about tracking user activity through VSCs using the practitioner method. The presentation is titled Ripping VSCs – Tracking User Activity and the slide deck can be found on my Google sites page.

I wanted to briefly mention a few things about the slides. The presentation is meant to compliment the information I’ve been blogging about in regards to Ripping VSCs. In my Ripping VSCs posts I outlined why the approach is important, how it works, and examples showing anyone can start applying the technique to their casework. I now want to put the technique into context by showing how it might apply to an examination. Numerous types of examinations are interested in what a user was doing on a computer so talking about tracking someone’s activities should be applicable to a wider audience. To help explain put the approach into context I created a fake fraud case study to demonstrate how VSCs provide a more complete picture about what someone did on a computer. The presentation will be a mixture of slides with live demos against a live Windows 7 system. Below are the demos I have lined up (if I am short on time then the last demo is getting axed):

        - Previewing VSCs with Shadow Explorer
        - Listing VSCs and creating symbolic links to VSCs using vsc-parser
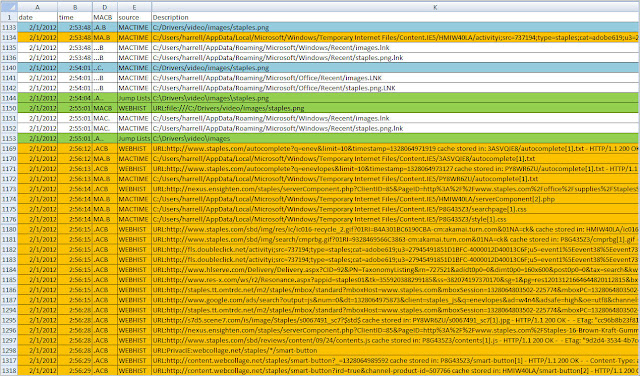
        - Parsing the link files in a user profile across VSCs using lslnk-directory-parse2.pl
        - Parsing Jump Lists in a user profile across VSCs using Harlan’s jl.pl
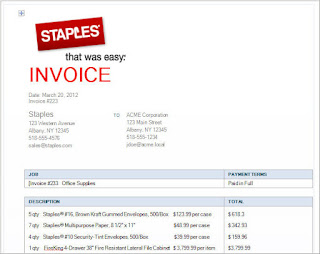
        - Extracting a Word document’s metadata across VSCs using Exiftool
        - Extracting and viewing a Word document from numerous VSCs using vsc-parser and Microsoft Word

I’m not covering everything in the slides but I purposely added additional information so the slides could be used as a reference. One example is the code for the batch scripts. Lastly, I’m working on my presentation skills so please lower your expectations. :)

Second Look at Prefetch Files

$
0
0
The one thing I like about sharing is when someone opens your eyes about additional information in an artifact you frequently encounter. Harlan has been posting about prefetch files and the information he shared changed how I look at this artifact. Harlan’s first post Prefetch Analysis, Revisited discussed how the artifact contains strings -such as file names and full paths to modules that were either used or accessed by the executable. He also discussed how the data can not only provide information about what occurred on the system but it could be used in data reduction techniques. One data reduction referenced was searching on the file paths for words such as temp. Harlan’s second post was Prefetch Analysis, Revisited...Again... and he expanded on what information is inside prefetch files. He broke down what was inside a prefetch from one of my test systems where I ran Metasploit against a Java vulnerability. His analysis provided more context to what I found on the system and validated some of my findings by showing Java did in fact access the logs I identified. Needless to say, his two posts opened my files to additional information inside prefetch files. Additional information I didn’t see the first the first time through but now I’m taking a second look to see what I find and to test out how one of Harlan's data reduction techniques would have made things easier for me.

Validating Findings

I did a lot of posts about Java exploit artifacts but Harlan did an outstanding job breaking down what was inside one of those Java prefetch files. I still have images from other exploit artifact testing so I took a look at prefetch files from an Adobe exploit and Windows Help Center exploit. The Internet Explorer prefetch files in both images didn’t contain any references to the attack artifacts but the exploited applications’ prefetch files did.

The CVE-2010-2883 (PDF Cooltype) vulnerability is present in the cooltype.dll affecting certain Adobe Reader and Acrobat versions. My previous analysis identified the following: the system had a vulnerable Adobe reader version, a PDF exploit appeared on the system, the PDF exploit is accessed, and Adobe Reader executed. The strings in the ACRORD32.EXE-3A1F13AE.pf prefetch file helped to validate the attack because it shows that Adobe Reader did in fact access the cooltype.dll as shown below.

\DEVICE\HARDDISKVOLUME1\PROGRAM FILES\ADOBE\READER 9.0\READER\COOLTYPE.DLL

The prefetch file from the Windows Help Center URL Validation vulnerability system showed something similar to the cooltype.dll exploit. The Seclists Full disclosure author mentioned that Windows Media Player could be used in an attack against the Help Center vulnerability. The strings in the HELPCTR.EXE-3862B6F5.pf prefetch file showed the application did access a Windows Media Player folder during the exploit.

\DEVICE\HARDDISKVOLUME1\DOCUMENTS AND SETTINGS\ADMINISTRATOR\LOCAL SETTINGS\APPLICATION DATA\MICROSOFT\MEDIA PLAYER\

Finding Malware Faster

Prefetch files provided more information about the exploit artifacts left on a system. By itself this is valuable enough but another point Harlan mentioned was using the strings inside prefetch files for data reduction. One data reduction technique is to filter on files' paths. To demonstrate the technique and how effective it is at locating malware I ran strings across the prefetch folder in the image from the post Examining IRS Notification Letter SPAM. (note, strings is not the best tool to analyze prefetch files and I’m only using the tool to illustrate how data is reduced) I first ran the following command which resulted in 7,905 lines.

strings.exe –o irs-spam-email\prefetch\*.pf

I wanted to reduce the data by only showing the lines containing the word temp to see if anything launched from a temp folder. To accomplish this I ran grep against the strings output which reduced my data to 84 lines (the grep -w switch matches on whole word and –i ignores case).

strings.exe –o irs-spam-email\prefetch\*.pf | grep –w –i temp

The number of lines went from 7,905 down to 84 which made it fairly easy for me to spot the following interesting lines.

\DEVICE\HARDDISKVOLUME1\DOCUME~1\ADMINI~1\LOCALS~1\TEMP\TEMPORARY DIRECTORY 1 FOR IRS%20DOCUMENT[1].ZIP\IRS DOCUMENT.EXE

\DEVICE\HARDDISKVOLUME1\DOCUME~1\ADMINI~1\LOCALS~1\TEMP\PUSK3.EXE

Using one filtering technique enabled me to quickly spot interesting executables in addition to the possibly finding the initial infection vector (a malicious zip file). This information was obtained by running only one command against the files inside a prefetch folder. In hindsight, my original analysis on the prefetch files was fairly limited (executable paths, runcounts, and filenames) but going forward I'll look at this artifact and the information they contain in a different light.

Volume Shadow Copy Timeline

$
0
0
Windows 7 has various artifacts available to help provide context about files on a system. In previous posts I illustrated how the information contained in jump lists, link files, and Word documents helped explain how a specific document was created. The first post was Microsoft Word Jump List Tidbit where I touched on how Microsoft Word jump lists contain more information than the documents accessed because there were references to templates and images. I expanded on the information available in Word jump lists in my presentation Ripping VSCs – Tracking User Activity. In addition to jump list information I included data parsed from link files, documents’ metadata, and the documents’ content. The end result was that these three artifacts were able to show –at a high level - how a Word document inside a Volume Shadow Copy (VSC) was created. System timelines are a great technique to see how something came about on a system but I didn’t create one for my fake fraud case study. That is until now.

Timelines are a valuable technique to help better understand the data we see on a system. The ways in how timelines are used is limitless but the one commonality is providing context around an artifact or file. In my fake fraud case I outlined the information I extracted from VSC 12 to show how a document was created. Here’s a quick summary of the user’s actions: document was created with bluebckground_finance_charge.dotx template, Microsoft Word accessed a Staples icon, and document was saved. Despite the wealth of information extracted about the document, there were still some unanswered questions. Where did the Staples image come from? What else was the user doing when the document was being created? These are just two questions a timeline can help answer.

The Document of Interest


Creating VSC Timelines


Ripping VSCs is a useful technique to examine VSCs copies but I don’t foresee using it for timeline creation. Timelines can contain a wealth of information from one image or VSC so extracting data across all VSCs to incorporate into a timeline would be way too much information. The approach I take with timelines is to initially include the artifacts that will help me accomplish my goals. If I see anything when working my timeline I can always add other artifacts but starting out I prefer to limit the amount of stuff I need to look at. (For more about how I approach timelines check out the post Building Timelines – Thought Process Behind It). I wanted to know more about the fraudulent document I located in VSC 12 so I narrowed my timeline data to just that VSC. I created the timeline using the following five steps:

        1. Access VSCs
        2. Setup Custom Log2timeline Plug-in Files
        3. Create Timeline with Artifacts Information
        4. Create Bodyfile with Filesystem Metadata
        5. Add Filesystem Metadata to Timeline

Access VSCs


In previous posts I went into detail about how to access VSCs and I even provided references about how others access VSCs (one post was Ripping Volume Shadow Copies – Introduction). I won’t rehash the same information but I didn’t want to omit this step. I identified my VSC of interest was still numbered 12 and then I created a symbolic link named C:\vsc12 pointing to the VSC.

Setup Custom Log2timeline Plug-in Files


Log2timeline has the ability to use plug-in files so numerous plug-ins can run at the same time. I usually create custom plug-in files since I can specify the exact artifacts I want in my timeline. I setup one plug-in file to parse the artifacts located inside a specific user profile while a second plug-in file parses artifacts located throughout the system. I discussed in more depth how to create custom plug-in files in the post Building Timelines – Tools Usage. However, a quick way to create a custom file is to just copy and edit one of the built-in plug-in files. For my timeline I did the following on my Windows system to setup my two custom plug-in files.

        - Browsed to the folder C:\Perl\lib\Log2t\input. This is the folder where log2timeline stores the input modules including plug-in files.

        - Made two copies of the win7.lst plug-in file. I renamed one file to win7_user.lst and the other to win7_system.lst (the files can be named anything you want).

        - Modified the win7_user.lst to only contain iehistory and win_link to parse Internet Explorer browser history and Windows link files respectfully.

        - Modified the win7_system.lst to only contain the following: oxml, prefetch, and recycler. These plug-ins parse Microsoft Office 2007 metadata, prefetch files, and the recycle bin.

Create Timeline with Artifacts Information


The main reason why I use custom plug-in files is to limit the amount of log2timeline commands I need to run. I could have skipped the previous step which would have caused me to run five commands instead of the following two:

        - log2timeline.pl -f win7_user -r -v -w timeline.csv -Z UTC C:/vsc12/Users/harrell

        - log2timeline.pl -f win7_system -r -v -w timeline.csv -Z UTC C:/vsc12

The first command ran the custom plug-in file win7_user (-f switch) to recursively (-r switch) parse the IE browser history and link files inside the harrell user profile. The Users folder inside VSC 12 had three different user profiles so pointing log2timeline at the one let me avoid adding unnecessary data from the other user profiles. The second command ran the win7_system plug–in file to recursively parse 2007 Office metadata, prefetch files, and recycle bins inside VSC 12. Both log2timeline commands stored the output in the file timeline.csv in UTC format.

Create Bodyfile with Filesystem Metadata


At this point my timeline was created and it contained timeline information from select artifacts inside VSC 12. The last item to add to the timeline is data from the filesystem. Rob Lee discussed in his post Shadow Timelines And Other VolumeShadowCopy Digital Forensics Techniques with the Sleuthkit on Windows how to use the sleuthkit (fls.exe) to create a bodyfiles from VSCs. I used the method discussed in his post to execute fls.exe directly against VSC 12 as shown below.

        - fls -r -m C: \\.\HarddiskVolumeShadowCopy12 >> bodyfile

The command made fls.exe recursively (-r switch) search VSC 12 for filesystem information and the output was redirected to a text file named bodyfile in mactime (-m switch) format.

Add Filesystem Metadata to Timeline


The timeline generated by Log2timeline is in csv format while the sleuthkit bodyfile is in mactime format. These two file formats are not compatible so I opted to convert the mactime bodyfile into the Log2timeline csv format. I did the conversion with the following command:

        - log2timeline.pl -f mactime -w timeline.csv -Z UTC bodyfile

Reviewing the Timeline


The timeline I created included the following information: filesystem metadata, Office documents’ metadata, IE browser history, prefetch files, link files, and recycle bin information. I manually included the information inside Microsoft Word’s jump list since I didn’t have the time to put together a script to automate it. The timeline provided more context about the fraudulent document I located as can be seen in the summary below.

1. Microsoft Word was opened to create the Invoice-#233-staples-Office_Supplies.docx (Office metadata)

2. BlueBackground_Finance_Charge.dotx Word template was created on the system (filesystem)

3. User account accessed the template (link files)

4. Microsoft Word accessed the template (jump lists)

5. User performed a Google search for staple (web history)

6. User visited Staples.com (web history)

7. User accessed the staples.png located in C:/Drivers/video/images/ (link files)

8. The staples.png image was created in the images folder (filesystem)

9. Microsoft Word accessed the staples.png image (jump lists)

10. User continued accessing numerous web pages on Staples.com

11. Microsoft Word document Invoice-#233-staples-Office_Supplies.docx was created on the system (office metadata and filesystem)

12. User accessed the Invoice-#233-staples-Office_Supplies.docx document (link files and jump lists)


Here are the screenshots showing the activity I summarized above.


Tale as Old as Time: Don’t Talk To Strangers

$
0
0
I was enjoying my Saturday afternoon doing various things around the house. My phone started ringing the caller ID showed it was from out of the area. I usually ignore these types of calls, but I answered this time because I didn’t want the ringing to wake my boys up from their nap. Dealing with a telemarketer is a lot easier than two sleep deprived kids.

Initially when I answered there was a few seconds of silence---then the line started ringing. My thought was “wait a minute, who is calling who here.” A female voice with a heavy accent picked up the phone; I immediately got flashbacks from my days dealing with foreign call centers when I worked in technical support. Then our conversation started:

Me: “Hello”
Female Stranger: “Is this Corey Harrell?”
Me: “Yes … who’s calling?”
Female Stranger: “This is Christina from Microsoft Software Maintenance Department calling about an issue with your computer. Viruses can be installed on computers without you knowing about it.”
Me: “What company are you with again?”
Female Stranger said something that sounded like “Esolvint”
Me in a very concerned tone: “Are you saying people can infect my computer without me even knowing it?”
Female Stranger: “Yes and your computer is infected.”

I knew immediately this was a telephone technical support scam, but I stayed on the line and pretended I knew nothing because I wanted to get first-hand experience about how these criminals operate. Conversation continued:

Female Stranger: “Are you at your computer?”
Me: “Yes”
Female Stranger: “Can you click the Start button then Run”
Me: “Okay …. The Start button then what? Something called Run”
Female Stranger: “What do you see?"
Me: “A box”
Female Stranger: “What kind of box”
Me: “A box that says Open With”
Female Stranger: “What do you see in the Open With path?”
Me: “Nothing” (At this point I had to withhold what I saw because then she might be on to me.)
Female Stranger: “You need to open the Event viewer to see your computer is infected”
Female Stranger: “Can you type in e-v-e-n-t-v-w-r”
Me: “I just typed in e-v-e-n-t-v-w-r”
Female Stranger: “Can you spell what is showing in the Open with path”
Me: “Eventvwr”
Female Stranger: “Can you spell what is showing in the Open with path”

The Female Stranger was taking too long to get to her point. I knew she was trying to get me to locate an error…any kind of error on my computer…to convince me my computer was infected and then from there she would walk me through steps to either give her remote access to my computer, actually infect my computer with a real virus or try to get my credit card information. I ran out of patience and changed the tone of the conversation.

Me: “Why are you trying to get me to access the Windows event viewer if you are saying I’m infected? The only thing in the Event viewer showing my computer was infected would be from an antivirus program but my computer doesn’t have any installed. The event viewer won’t show that my computer is infected”
Female Stranger sticking to the script: “You need to access the event viewer ….”
Me (as I rudely cut her off): “You can stop following your script now”
Female Stranger: complete silence
Me: “I know your scam and I know you are trying to get me to either infect my computer or give you remote access to my computer….”


She then hung up. I believe she knew I was on to her. It’s unfortunate since I wish she had heard everything I had to say about how I feel about people like her who try to take advantage of others. My guess is she wouldn’t care and just moved onto the next potential victim. Could that victim be you?


I’m sharing this cautionary tale so others remember the tale as old as time…”Don’t Talk To Strangers.” Especially when it comes to your private information….especially in the cyber world. Companies will not call you about some issue with your computer. Technical support will not contact you out of the blue knowing your computer is infected (unless it’s your help desk at work). Heck … even your neighborhood Geek won’t call you knowing there is something wrong with your computer.


If someone does then it’s a scam. Plain and simple some criminal is trying to trick you into giving them something. It might be to get you to infect your computer, give them access to your computer, or provide them with your credit card information. The next time you pick up a phone and someone on the other end says there is an issue with your computer let your spidey sense kick in and HANG UP.


Information about this type of scam is discussed in more detail at:


* Microsoft’s article Avoid Tech Support Phone Scams


* Sophos’ article Canadians Increasingly Defrauded by Fake Tech Support Phone Calls


* The Guardian’s article Virus Phone Scam Being Run from Call Centers in India


Updated links courtesy of Claus from Grand Stream Dreams:

Troy Hunt's Scamming the scammers – catching the virus call centre scammers red-handed

Troy Hunt's Anatomy of a virus call centre scam


I reposted my Everyday Cyber Security Facebook page article about my experience to reach a broader audience to warn others. The writing style is drastically different then what my blog readers are accustomed. My wife even edits the articles to make sure they are understandable and useful to the average person.

Improvise Adapt Overcome

$
0
0

Everybody has a story about how they became involved in DFIR. Showing the different avenues people took to reach the same point can be helpful to others trying to break into the field. I’ve been thinking about my journey and the path that lead me to become the forensicator who I am today. This is my story …

My story doesn’t start with me getting picked up by another DFIR team, being shown the reins by an experienced forensicator, or being educated in a digital forensic focused curriculum. My story starts many years ago when I took the oath and became a United States Marine. The Marines instilled into me the motto: improvise, adapt, and overcome. When I was in the Marines, I didn’t get the newest equipment, the latest tools, or other fancy gadgets. Things happen and it was not always the best of circumstances but I had to make do with what I had by improvising, adapting, and overcoming. This motto was taught to me when I first entered the Corps. Gradually it became a part of who I was; it became second nature when I was faced with any kind of adversity. Reflecting back on my journey I can easily see I ended up in DFIR by improvising, adapting, and overcoming the various situations I found myself in. Before I discuss those situations I think it’s necessary to define what exactly the Marines’ motto means:


jIIr (Star Wars Character)

Improvise: leverage the knowledge and resources available. You need to be creative to solve the situation you are going through.

Adapt: adjust to whatever situation being faced. Whether if its things not going as planned, lack of resources, issues with employment, or just adversity while doing your job. Whatever happens you need to make adjustments and adapt to the situation at hand.

Overcome: prevail over the situation. With each situation conquered you come out more knowledgeable and in a better position to handle future adversity.

Did I Take the Wrong Job


I was first exposed to the information security field in my undergraduate coursework and the field captivated my interest. However, at the time security jobs in my area were scarce so I opted to go into I.T. One of my first jobs after I graduated was not the most ideal conditions. I picked up on this on my first day on the job. A few hours were spent showing me the building locations throughout the city, introducing me to a few people, and pointing out my desk. That was it; there was no guidance on what was expected of me, explaining the network, training, etc. In addition, hardly any resources were provided to us to do our jobs. To illustrate, we needed some basic equipment (cabling, crimpers, connectors, …) so I did research and identified the most cost effective equipment which came in around $300. My purchase request was denied and then I narrowed the equipment down to the bare minimum for about a cost of $70. This was still denied since it was $70 too much. This lack of support went across the board for everything in our office. You were asked to do so many things but virtually no support was provided to make you successful. As I mentioned before, this was not the most ideal working condition.

I adapted to the environment by dedicating my own resources to improve myself by increasing my skillset and knowledge. I didn’t have access to a budget so I learned how to use free and open source software to get the job done. I couldn’t rely on any outside help so I used my problem solving skills to find my own answers to problems or coming up with my own solutions. Within a short period of time I went from questioning my decision to take the job to becoming the one managing the entire Windows network. I had the flexibility to try and do what I wanted on the network. I even used the position to increase my security skills by learning how to secure the Windows network. In the end the job became one of the best places I worked at and my knowledge grew by leaps and bounds.

Landed My First InfoSec Gig


The way I improvised, adapted, and overcame the issue I faced at a previous employer helped me land my first information security position. I joined a network security unit within an organization’s auditing department. My initial expectation was to bring my technical expertise to the table to help perform security assessments against other New York State agencies. My first week on the job I encountered my first difficulty. The other technical person I was supposed to work with resigned and his last week was my first week. My other co-worker was an auditor so I didn’t have a technical person to bring me up to speed on what I needed to do. Adapting to this situation was easier because of the resources my organization provided me. I had at my disposal: books, Internet, a test network, servers, clients, great supervisors, access to previous completed work, and time. In addition to these resources, I drew on my years of experience in IT and the information security knowledge I gained in my Windows admin days. Over time I increased my knowledge about information security (at management and technical levels) and I honed my skills in performing security assessments. On my first engagement where I helped come up with the testing methodology against an organization we were highly successfully. Within an extremely short period of time we had full control over their network and the data stored on it.

Welcome to DFIR


As I said I’m in a security unit within an auditing department. One activity other units in my department perform is conducting fraud audits. As a result, at times auditors need assistance with not only extracting electronic information from networks but help in validating if and how a fraud is occurring. I was tasked with setting up a digital forensic process to support these auditors even though I didn’t have any prior experience. I accepted the challenge but I didn’t take it lightly because I understood the need to do forensics properly. I first drew on my previous experience in evidence handling I gained when I managed the video cameras not only mounted in vehicles but scattered throughout the city. I even reached out to a friend who was a LE forensicator in addition to using the other resources I had available (training, books, Internet, test network, and time). I overcame the issue of setting up a digital forensic process from scratch. I established a process that went from supporting just my department to numerous departments within my organization. A process capable of processing cases ranging from fraud to investigations to a sprinkle of security incidents.

Improvise – Adapt – Overcome


The Marines instilled in me how to overcome adversity in any type of situation. This mentality stayed with me as I moved onto to other things in life and it was a contributing factor to how I ended up working DFIR. Whenever you are faced with adversity just remember Gunny Highway’s words:


Forensic4cast Awards


Forensic4Cast released the 2012 award nominees. I was honored to see my name listed among the nominees (blog of the year and examiner of the year). I am in outstanding company with Melia Kelley (Girl, Unallocated) and Eric Huber (A Fistful of Dongles) both of which are outstanding blogs. For Examiner of the Year I’m accompanied with Kristinn Gudjonsson (log2timeline literal changed how I approach timelines) and Cindy Murphy whose everyday efforts are improving our field. Both of these individuals are very deserving of this award. It’s humbling to see my work reflected in the Forensic4Cast awards especially since it was only about four years ago when my supervisor’s simple request launched me into the DFIR community. I wanted to say thank you to those who nominated me and wanted to encourage anyone who hasn’t voted for any of the nominees to do so. People have put in a lot of their own time and resources to improve our community and they deserve to be recognized for their efforts.

Cleaning Out the Linkz Hopper

$
0
0
Volume Shadow Copies has been my main focus on the blog for the past few months. I took the time needed to share my research because I wanted to be thorough so others could use the information. As a result, the interesting linkz I’ve been coming across have piled up in my hopper. In this Linkz post I’m cleaning out the hopper. There are linkz about: free DFIR e-magazines, volume shadow copies, triage, timeline analysis, malware analysis, malware examinations, Java exploits, and an interesting piece on what you would do without your tools. Phew …. Let’s roll

Into The Boxes has Returned


Into The Boxes is an e-magazine discussing topics related to Digital Forensic and Incident Response. When the magazine was first released a few years ago I saw instant value in something like this for the community. A resource that not only provides excellent technical articles about DFIR but also compliments what is already out there in the community. I really enjoyed the first two editions but a third issue was never released…. That is until now. The ITB project is back up and running as outlined in the post Into The Boxes: Call for Collaboration 0×02 – Second Try.

It looks like ITB won’t be the only free DFIR magazine on the block. Lee Whitfield is starting up another free magazine project called Forensic 4cast Magazine. His magazine will also be discussing topics related to Digital Forensic and Incident Response.

It’s great to see projects like these but they will only be successfully with community support such as feedback and more importantly writing articles. Without support then efforts like these will go to where great ideas go to die. I’m willing to step up to the plate to be a regularly contributor of original content. I’ll be writing for ITB and my first article discusses how to find out how a system was infected after I.T. tried to clean the infection. Cleaning a system makes it harder to answer the question of how but it doesn’t make it impossible. Stay tuned to see what artifacts are left on a cleaned system in an upcoming ITB edition.

RegRipper Plugins Maintenance Perl Script


This link is cool for a few reasons. Sometime ago Cheeky4n6Monkey sent me an email introducing himself and asking if I had any project ideas. I knew who Cheeky was even before his introductory email because I’ve been following his outstanding blog. I thought this was really cool; he is looking to improve his DFIR skills by trying to reach out and help others. He isn’t taking a passive approach waiting for someone to contact him but he is doing the complete opposite. I went over my idea hopper and there was one thing that has been on my to-do list for some time. At times I wanted to review the RegRipper profiles to update the plugins listed. However, I didn’t want to manually review every plugin to determine what the profile was missing. A better approach would be to flag each plugin not listed which would then reduce the number of plugins I had to be manually review. I mentioned the idea to Cheeky and he ran with it. Actually he went warp speed with the idea because he completed the script within just a few days. To learn more about his script and how to use it check out the post Creating a RegRipper Plugins Maintenance Perl Script.

VSC Toolset


The one thing I like about the DFIR community is the people who willingly share information. Sharing information not only educates us all thus making us better at our jobs but it provides opportunities for others to build onto their work. Case in point, I didn’t start from scratch with my Ripping VSCs research since I looked at and built on the work done by Troy Larson, Richard Drinkwater, QCCIS, and Harlan. I was hoping others would take the little research I did and take it another step forward. That is exactly what Jason Hale from Digital Forensics Stream did. Jason put together the VSC Toolset: A GUI Tool for Shadow Copies and even added additional functionality as outlined in the post VSC Toolset Update. The VSC Toolset makes it extremely easy for anyone to rip VSCs and to add additional functionality to the tool. Seriously, it only takes one line in a batch file to extend the tool. Jason lowered the bar for anyone wanting to examine VSCs using this technique.

Triage Script


When I put together the Tr3Secure Data Collection script I was killing two birds with one stone. First and foremost, the script had to work when responding to security incidents. Secondly, the script had to work for training purposes. I built the script using two different books so people could reference them if they had any questions about the tools or the tools’ output. As such, the one limitation with the Tr3Secure Data Collection is it doesn’t work remotely against systems. Michael Ahrendt (from Student of Security) released his Automated Triage Utility and has since updated his program. One capability Automated Triage Utility has is being able to run against remote systems. To see how one organization benefited by Michael’s work check out Ken Johnson (from Random Thoughts of Forensic) post Tools in the Toolbox – Triage. If you are looking for triage scripts to collect data remotely then I wouldn’t overlook Kludge 3.0. The feedback about Kludge in the Win4n6 Yahoo group has been very positive.

HMFT – Yet Another $MFT extractor


Speaking about Triage, Adam over at Hexacon recently released his HMFT tool in the post HMFT – Yet Another $MFT extractor. I was testing out the script and it grabbed an MFT off a live Windows 7 32 bit Ultimate system within a few seconds. One area where I think HMFT will be helpful is in triage scripts. Having the ability to grab a MFT could provide useful filesystem information including the ability to see activity on a system around a specific time of interest. I plan on updating the Tr3secure Data Collection script to incorporate HMFT.

Strings for Malware Analysis


While I’m talking about Adam I then I might as well mention another tool he released. Sometime ago he released the HAPI – API extractor. The tool will identify all the Windows APIs present in a file’s strings. I’ve been working my way through Practical Malware Analysis (except a full review soon) and one of the steps during static analysis is reviewing a file’s strings. Identifying the Windows APIs in strings may give a quick indication about the malware’s functionality and HAPI makes it so much easier to find the APIs. I added the tool to my toolbox and it will be one of the tools I run whenever I’m static analysis against malware.

Need for Analysis on Infected Systems


Harlan recently discussed the need to perform analysis on infected systems as a means to gather actionable intelligence. His first post where this was mentioned was The Need for Analysis in Intelligence-Driven Defense while the second one was Updates and Links. Alright, Harlan made a lot of great points in those both besides the need to analysis infected systems and they are both definitely worth the read. I’ve heard discussions among digital forensic practitioners about performing analysis on infected systems to determine how the infection occurred. A few responses included: it’s too hard, too time consuming, or most of the time you can’t tell how the infection occurred. People see the value in the information learned by performing an examination but there is no follow through by actually doing the exam. It makes me wonder if one of the roadblocks is that people aren’t really sure what they should be looking for since they don’t know what the Attack Vector Artifacts look like.

NTFS INDX Files


Sometime time ago William Ballenthin released his INDXParse script that can be used to examine NTFS INDX files. To get a clearer picture about the forensic significance of INDX files you can check out Chad Tilbury’s post NTFS $I30 Index Attributes: Evidence of Deleted and Overwritten Files in addition to the information provided by William Ballenthin. INDXParse comes with an option to use a bodyfile as the output (-b switch) and this can be used to add the parsed information to a timeline. Don’t forget that next week William Ballenthin is presenting about his INDX files research in a DFIROnline special edition.

Colorized Timeline Template


Rob Lee created a timeline template to automate colorizing a timeline when imported into Excel. His explanation about the template can be found on his post Digital Forensic SIFTing: Colorized Super Timeline Template for Log2timeline Output Files. Template aside, the one thing I like about the information Rob shared is the color coding scheme to group similar artifacts. To name a few: red for program execution, orange for browser usage or yellow for physical location. Using color in a timelines is a great idea and makes it’s easier to see what was occurring on a system with a quick glance.

Checklist to See If A System's Time Was Altered


Rounding out the posts about time is Lee Whitfield’s slide deck Rock Around the Clock. In the presentation, Lee talks about numerous artifacts to check to help determine if the time on the system was altered. After reading his slides over and the information he provided makes a great checklist one could follow if a system’s time comes into question. The next time I need to verify if someone changed the system clock then I’ll follow these steps as outlined by Lee. I copied and pasted my personal checklist so if any information is listed below that didn’t come from Lee’s slide deck then I picked it up from somewhere else.

        - NTFS MFT entry number
                * New files are usually created in sequence. Order files by creation then by identifier. Small discrepancies are normal but large require further investigation

        - Technology Advancement
                * Office, PDF, Exif images, and other items' metadata show program used to create it. Did the program exist at that time?

        - Windows Event Logs
                * Order event logs in order then review the date/time stamps that are out of order
                * XP Event ID 520 in security log "the system time was changed" (off by default) Vista, 7 Event ID 1 in system log "the system time has changed to ..." and event id 4616 in security log "the system time was changed"

        - NTFS Journal
                * Located in the $J stream of $UsnJrnl and may hold few hours or days of data. Entries sequentially stored

        - Link files
                * XP each link file has a sequence number (fileobjectid). Sort by creation date then review sequence number

        - Restore Points
                * XP restore points named sequentially. Sort by creation date then review RP names for out of sequence

        - Volume Shadow Copies
                * VSC GUIDs are similarly named for specific times
                * Sort by creation data and then review the VSC names to identify ones out of place

        - Web pages (forums, blogs, or news/sports sites)
                * Cached web pages may have date/time

        - Email header

        - Thumbnails
               * XP one repository for each folder and Vista/7 one for all folders. Both store items sequentially.
               * Sort by file offsets order then review for out of place dates

Attackers Are Beating Java Like a Red Headed Stepchild


I don’t have much narration about Java exploits since I plan on blogging about a few case experiences involving it. I had these links under my exploits category and wanted to get rid of them so I can start fresh. Towards the end of last year a new Java vulnerability was being targeted and numerous attacks started going after it. DarkReading touched on this in the article The Dark Side Of Java and Brian Krebs did as well in the post New Java Attack Rolled Into Exploit Kits. The one interesting thing about the new Java attack from the DFIR perspective is it looks the same on a system as other Java exploits going after different vulnerabilities. It’s still good to be informed about what methods the attackers are using. Another link about Java was over at the Zscaler Threatlab blog. There’s an excellent write-up showing how a Java Drive-by Attack looks from the packet capture perspective.

What Can You Do Without Your Tools


The Security Shoggoth blog's post Tools and News provided some food for thought. The post goes into more depth on the author’s tweet: Want to find out how good someone is? Take away all their tools and say, "Now do it.". When I first got started in DFIR I wanted to know the commercial tool I had available inside and out. I learned as much as I could about the tool except learning how to write enscripts. Then one day I thought to myself, could I do forensics for another shop if they don’t have Encase and the answer was unfortunately no. I think there are a lot of people in our field who fall into the on commercial tool boat. They can do wonders with their one tool but if they don’t have access to it or if the tool can’t do something then they get stuck. I made the decision to improve my knowledge and skills so I could do my job regardless of the tools I had available. The change didn’t happen overnight and it took dedication to learn how to do my job using various tools for each activity. Try to answer two of the questions the author mentioned in his post and if you are unable to fully answer them then at least you know an area needing improvement.

Imagine for a moment that you didn't have the tool(s) you use most in your job - how would you perform your job? What alternatives are available to you and how familiar you are with them?

Practical Malware Analysis Book Review

$
0
0
There are times when I come across malware on systems. It happens when I’m helping someone with computer troubles to processing a DFIR case to providing assistance on a security incident. It seems as if malware is frequently lurking beneath the surface. Occasionally I thought it might be helpful to know not only what the malware on those systems was up to but also what the malware was incapable of doing. Practical Malware Analysis breaks down the art of analyzing malware so you can better understand how it works and what its capabilities are. PMA is an excellent book and I highly recommend it for the following reasons: understanding malware better, training, and extending test capabilities.

Understanding Malware Better


A very telling quote from the book’s opening is “when analyzing suspected malware, your goal will typically be to determine exactly what a particular suspect binary can do, how to detect it on your network, and how to measure and contain its damage”. Practical Malware Analysis outlines how to meet that goal by outlining a process to follow and the tools to use. Part 1 covers basic analysis demonstrating how to better understand a program’s functionality by using basic static and dynamic analysis. Part 2 builds on the basic analysis by diving deeper into static analysis by analyzing the malware’s assembly code. Part 3 continues by discussing an advanced dynamic analysis technique which was debugging. The book is written in a way where it is fairly easy to follow along and understand the content about the analysis techniques. The later sections in the book: Part 4 Malware Functionality, Part 5 Anti-Reverse-Engineering, and Part 6 Special Topics provided a wealth of information about malware and what someone may encounter during their analysis.

I don’t foresee myself becoming a malware reverse engineer. This wasn’t what I had in mind when I started reading PMA. My intentions were to learn the techniques in PMA so I could be better at my DFIR job. To quickly get intelligence when I’m examining an infected system to help explain what occurred. To be able to rule out malware located on systems from being accused of the reason why certain actions happened on a system. PMA went beyond my expectations and I can honestly say I’m better at my job because I read it.

Training


Practical Malware Analysis follows the No Starch publishing practical approach which is to reinforce content by providing data the reader can analyze as they follow along. The book provides a wealth of information about analyzing malware then follows it up with about 57 labs. The authors indicated they wrote custom programs for the book and this means there are a lot of samples to practice the malware analysis techniques on. The labs are designed so the reader has to answer specific questions by analyzing a sample and afterwards the solutions can be referenced to see the answers. A cool thing about the solutions is that there are short and long versions. The short versions only provide the answers while the long version walks the reader through the analysis demonstrating how the answers were obtained. The combination of the content, labs, samples, and solutions makes PMA a great self training resource.

PMA contains so much information it’s one of those books where people can keep going back to review specific chapters. I can see myself going back over numerous chapters and redoing the labs as a way to train myself on malware analysis techniques. PMA is not only a great reference to have available when faced with malware but it’s even a greater training resource to have regular access to.

Extending Test Capabilities


The process and techniques described in PMA can be used for other analysis besides understanding malware. A friend of mine who was also reading the book (when I was working my way through it) had to take a look at a program someone in his organization was considering using. Part of his research into the program was to treat it like malware and he used out some of the techniques described in PMA. It was very enlighten the information he learned about the program by incorporating malware analysis techniques into his software testing process. I borrowed his idea and started using some PMA techniques as part of my process when evaluating software or software components. I already used it on one project and it helped us identify the networking information we were looking for. The process and tools discussed in the book helped my friend and myself extend our software testing capabilities so it stands to reason it could do the same for others.

Five Star Review


PMA is another book that should be within reaching distance in anyone’s DFIR shop. I went ahead and purchased PMA hoping the book would improve my knowledge and skills when faced with malware. What I ended up with was knowledge, a process and tools I can use to analyze any program I encounter. PMA gets a five star review (5 out of 5).

One area I thought could be improved with PMA was providing more real life examples. It would have been helpful if the authors shared more of their real life experiences about analyzing malware or how the information obtained from malware analysis helped when responding to an incident. I think sharing past experiences is a great way to provide more context since it lets people see how someone else approached something.

More About Volume Shadow Copies

$
0
0

CyberSpeak Podcast About Volume Shadow Copies


I recently had the opportunity to talk with Ovie about Volume Shadow Copies (VSCs) on his CyberSpeak podcast. It was a great experience to meet Ovie and see what it’s like behind the scenes. (I’ve never been on a podcast before and I found out quickly how tough it is to explain something technical without visuals). The CyberSpeak episode May 7 Volume Shadow Copies is online and in it we talk about examining VSCs. In the interview I mentioned a few different things about VSCs and I wanted to elaborate on a few of them. Specifically, I wanted to discuss running the Regripper plugins to identify volumes with VSCs, using the Sift to access VSCs, comparing a user profile across VSCs, and narrowing down the VSC comparison reports with Grep.

Determining Volumes with VSCs and What Files Are Excluded from VSCs


One of my initial steps on an examination is to profile a system so I can get a better idea about what I’m facing. I information I look at includes: basic operating system info, user accounts, installed software, networking information, and data storage locations. I do this by running Regripper in a batch script to generate a custom report containing the information I want. I blogged about this previously in the post Obtaining Information about the Operating System and I even released my Regripper batch script (general-info.bat). I made some changes to the batch script; specifically I added the VSCs plugins spp_clients.pl and filesnottosnapshot.pl. The spp_clients.pl plugin obtains the volumes monitored by the Volume Shadow Copy service and this is an indication about what volumes may have VSCs available. The filesnottosnapshot.pl plugin gets a list of files/folders that are not included in the VSCs (snapshots). The information the VSCs plugins provide is extremely valuable to know early in an examination since it impacts how I may do things.

While I’m talking about RegRipper, Harlan released RegRipper version 2.5 his post RegRipper: Update, Road Map and further explained how to use the new RegRipper to extract info from VSCs in the excellent post Approximating Program Execution via VSC Analysis with RegRipper. RegRipper is an awesome tool and is one of the few tools I use on every single case. The new update lets RR run directly against VSCs making it even better. That’s like putting bacon on top of bacon.

Using the Sift to Access VSCs


There are different ways to access VSCs stored within an image. Two potential ways are using Encase with the PDE module or the VHD method. Sometime ago Gerald Parsons contacted me about another way to access VSCs; he refers to it as the iSCSI Initiator Method. The method uses a combination of Windows 7 iSCSI Initiator and the Sift workstation. I encouraged Gerald to do a write-up about the method but he was unable to due to time constraints. However, he said I could share the approach and his work with others. In this section of my post I’m only a ghost writer for Gerald Parsons and I’m only conveying the detailed information he provided me including his screenshots. I only made one minor tweak which is to provide additional information about how to access a raw image besides the e01 format.

To use the iSCSI Initiator Method requires a virtual machine running an iSCSI service (I used the Sift workstation inside VMware) and the host operating system running Windows 7. The method involves the following steps:

Sift Workstation Steps

1. Provide access to image in raw format
2. Enable the SIFT iSCSI service
3. Edit the iSCSI configuration file
4. Restart the iscsitarget service

Windows 7 Host Steps

5. Search for iSCSI to locate the iSCSI Initiator program
6. Launch the iSCSI Initiator
7. Enter the Sift IP Address and connect to image
8. Examine VSCs

Sift Workstation Steps


1. Provide access to image in raw format

A raw image needs to be available within the Sift workstation. If the forensic image is already in the raw format and is not split then nothing else needs to be done. However, if the image is a split raw image or is in the e01 format then one of the next commands needs to be used so a single raw image is available.

Split raw image:

sudo affuse path-to-image mount_point

E01 Format use:

sudo mount_ewf.py path-to-image mount_point

2. Enable the SIFT iSCSI service

By default, in Sift 2.1 the iSCSI is turned off so it needs to be turned on. The false value in the /etc/default/iscsitarget configuration file needs to be change to true. The commands below uses the Gedit text editor to accomplish this.

sudo gedit /etc/default/iscsitarget

(Change “false” to “true”)


3. Edit the iSCSI configuration file

The iSCSI configuration file needs to be edited so it points to your raw image. Edit the /etc/ietd.conf configuration file by performing the following (the first command opens the config file in the text editor Gedit):

sudo gedit /etc/ietd.conf

Comment out the following line by adding the # symbol in front of it:

Target iqn.2001-04.com.example:storage.disk2.sys1.xyz

Add the following two lines (the date can be whatever you want (2011-04) but make sure the image path points to your raw image):

Target iqn.2011-04.sift:storage.disk
Lun 0 Path=/media/path-to-raw-image,Type=fileio,IOMode=ro


4. Restart the iscsitarget service

Restart the iSCSI service with the following command:

sudo service iscsitarget restart


Windows 7 Host Steps


5. Search for iSCSI to locate the iSCSI Initiator program

Search for the Windows 7 built-in iSCSI Initiator program


6. Launch the iSCSI Initiator

Run the iSCSI Initiator program

7. Enter the Sift IP Address and connect to image

The Sift workstation will need a valid IP address and the Windows 7 host must be able to connect to the Sift using it. Enter the Sift’s IP address then select the Quick Connect.


A status window should appear showing a successful connection.


8. Examine VSCs

Windows automatically mounts the forensic image’s volumes to the host after a successful iSCSI connection to the Sift. In my testing it took about 30 seconds for the volumes to appear once the connection was established. The picture below shows Gerald’s host system with two volumes from the forensic image mounted.


If there are any VSCs on the mounted volumes then they can be examined with your method of choice (cough cough Ripping VSCs). Gerald provided additional information about how he leverages Dave Hull’s Plotting photo location data with Bing and Cheeky4n6Monkey Diving in to Perl with GeoTags and GoogleMaps to extract metadata from all the VSCs images to create maps. He extracts the metadata by running the programs from the Sift against the VSCs.

Another cool thing about the iSCSI Initiator Method (besides being another free solution to access VSCs) is the ability to access the Sift iSCSI service from multiple computers. In my test I connected a second system on my network to the Sift iSCSI service while my Windows 7 host system was connected to it. I was able to browse the image’s volumes and access the VSCs at the same time from my host and the other system on the network. Really cool…. When finished examining the volumes and VSCs then you can disconnect the iSCSI connection (in my testing it took about a minute to completely disconnect).


Comparing User Profile Across VSCs


I won’t repeat everything I said in the CyberSpeak podcast about my process to examine VSCs and how I focus on the user profile of interest. Focusing on the user profile of interest within VSCs is very powerful because it can quickly identify interesting files and highlight a user’s activity about what files/folders they accessed. Comparing a user profile or any folder across VSCs is pretty simple to do with my vsc-parser script and I wanted to explain how to do this.

The vsc-parser is written to compare the differences between entire VSCs. In some instances this may be needed. However, if I’m interested in what specific users were doing on a computer then the better option is to only compare the user profiles across VSCs since it’s faster and provides me with everything I need to know. You can do this by making two edits to the batch script that does the comparison. Locate the batch file named file-info-vsc.bat inside the vsc-parser folder as shown below.


Open the file with a text editor and find the function named :files-diff. The function executes diff.exe to identify the differences between VSCs. There are two lines (lines 122 and 129) that need to be modified so the file path reflects the user profile. As can be seen in the picture below the script is written to use the root of the mounted image (%mount-point%:\) and VSCs (c:\vsc%%f and c:\vsc!f!).


These paths need to be changed so they reflect the user profile location. For example, let's say we are interested in the user profile named harrell. Both lines just need to be changed to point to the harrell user profile. The screenshot below now shows the updated script.


When the script executes diff.exe there the comparison reports are placed into the Output folder. The picture below shows the reports for comparing the harrell user profile across 25 VSCs.


Reducing the VSCs Comparison Reports


When comparing a folder such as a user profile across VSCs there will be numerous differences that are not relevant to your case. One example could be the activity associated with Internet browsing. The picture below illustrates this by showing the report comparing VSC 12 to VSC11.


The report showing the differences between VSC12 and VSC11 had 720 lines. Looking at the report you can see there are a lot of lines that are not important. A quick way to remove them is to use grep.exe with the –v switch to only display non-matching lines. I wanted to remove the lines in my report involving the Internet activity. The folders I wanted to get rid of were: Temporary Internet Files, Cookies, Internet Explorer, and History.IE5. I also wanted to get rid of the activity involving the AppData\LocalLow\ CryptnetUrlCache folder. The command below shows how I stacked my grep commands to remove these lines and I saved the output into a text file named reduced_files-diff_vsc12-2-vsc11.txt .

grep.exe -v "Temporary Internet Files" files-diff_vsc12-2-vsc11.txt | grep.exe -v Cookies | grep.exe -v "Internet Explorer" | grep.exe -v History.IE5 | grep.exe -v CryptnetUrlCache > reduced_files-diff_vsc12-2-vsc11.txt

I reduced the report from 720 lines to 35. It’s good practice to look at the report again to make sure no obvious lines were missed before running the same command against the other VSC comparison reports. Staking grep commands to reduce the amount of data to look at makes it easier to spot items of potential interest such as documents or Windows link files. It’s pretty easy to see that the harrell user account was accessing a Word document template, an image named staples, and a document named Invoice-#233-Staples-Office-Supplies in the reduced_files-diff_vsc12-2-vsc11.txt report shown below.


I compare user profiles across VSCs because it’s a quick way to identify data of interest inside VSCs. Regardless, if the data is images, documents, user activity artifacts, email files, or anything else that may stored inside a user profile or that a user account accessed.


Finding Fraudulent Documents Preview

$
0
0
Anyone who looks at the topics I discuss on my blog may not easily see the kind of cases I frequently work at my day job. For the most part my blog is a reflection of my interests, the topics I’m trying to learn more about, and what I do outside of my employer. As a result, I don’t blog much about the fraud cases I support but I’m ready to share a technique I’ve been working on for some time.

Next month I’m presenting at the SANs Forensic and Incident Response Summit being held in Austin Texas. The summit dates are June 26 and 27. I’m one of the speakers in the SANs 360 slot and the title of my talk is “Finding Fraudulent Word Documents in 360 Seconds” (here is the agenda). My talk is going to quick and dirty about a technique I honed last year to find fraudulent documents. I’m writing a more detailed paper on the technique as well as a query script to automate finding these documents but my presentation will cover the fundamentals. Specifically, what I mean by fraudulent documents, types of frauds, Microsoft Word metadata, Corey’s guidelines, and the technique in action. Here’s a preview about what I hope to cover in my six minutes (subject to change once I put together the slides and figure out my timing).

What exactly are fraudulent documents? You need to look at the two words separately to see what I’m referring to. One definition for fraudulent is “engaging in fraud; deceitful” while a definition for document is “a piece of written, printed, or electronic matter that provides information or evidence or that serves as an official record”. What I’m talking about is electronic matter that provides information or serves as an official record while engaging in fraud. In easier terms and the way I describe it: electronic documents providing fake financial information. There are different types of fraud which means there are different types of fraudulent documents. However, my technique is geared towards finding the electronic documents used to commit purchasing fraud and bid rigging.

There are a few different ways these frauds can be committed but there are times when Microsoft Word documents are used to provide fake information. One example is an invoice for a product that was never purchased to conceal misappropriated money. As most of us know electronic files contain metadata and Word documents are no different. There are values within Word documents’ metadata that provide strong indicators if the document is questionable. I did extensive testing to determine how these values change based on different actions taken against a document (Word versions 2000, 2003, and 2007). My testing showed the changes in the metadata are consistent based on the action. For example, if a Word document is modified then specific values in the metadata changes while other values remain the same.

I combined the information I learned from my testing with all the different fraudulent documents I’ve examined and I noticed distinct patterns. These patterns can be leveraged to identify potential fraudulent documents among electronic information. I’ve developed some guidelines to find these patterns in Word documents’ metadata. I’m not discussing the guidelines in this post since I’m saving it for my #DFIRSummit presentation and my paper. The last piece is tying everything together by doing a quick run through about how the technique can quickly find fraudulent documents for a purchasing fraud. Something I’m hoping to include is my current work on how I’m trying to automate the technique using a query script I’m writing and someone else’s work (I’m not mentioning who since it's not my place).

I’m pretty excited to finally have the chance to go to my first summit and there’s a great lineup of speakers. I was half joking on Twitter when I said it seems like the summit is the DFIR Mecca. I said half because it’s pretty amazing to see the who else will be attending.  


Compromise Root Cause Analysis Model

$
0
0
A common question runs through my mind every time I read an article about: another targeted attack, a mass SQL injection attack, a new exploit being rolled into exploit packs, or a new malware campaign. The question I ask myself is how would the attack look on a system/network from a forensic perspective. What do the artifacts look like that indicates the attack method used. Unfortunately, most security literature doesn’t include this kind of information for people to use when responding to or investigating attacks. This makes it harder to see what evidence is needed to answer the questions “how” and “when” of the compromise. I started researching Attack Vector Artifacts so I could get a better understanding about the way different attacks appear on a system/network. What started out as a research project to fill the void I saw in security literature grew into an investigative model one can use to perform compromise root cause analysis. A model I’ve been successfully using for some time to determine how systems became infected. It’s been awhile since I blogged about attack vector artifacts so I thought what better way to revisit the subject than sharing my model.

DFIR Concepts


Before discussing the model I think it’s important to first touch on two important concepts. Locard’s Exchange Principle and Temporal Context; both are key to understanding why attack vector artifacts exist and how to interpret them.

Locard’s Exchange Principle states when two objects come into contact, something is exchanged from one to the other. Harlan’s writing about the Locard’s Exchange Principle is what first exposed me to how this concept applies to the digital world. The principle is alive and well when an attacker goes after another system or network; the exchange will leave remnants of the attack on the systems involved. There is a transfer between the attacker’s systems with the targeted network/systems. An excellent example of the Locard’s Exchange Principle occurring during an attack can be seen in my write-up Finding the Initial Infection Vector. The target system contained a wealth of information about the attack. There was malware, indications Java executed, Java exploits, and information about the website that served up the exploits. All this information was present because the targeted system came into contact with the web server used in the attack. The same will hold true for any attack; there will be a transfer of some sort between the systems involved in an attack. The transfer will result in attack vector artifacts being present on the targeted network in the attack.

Temporal Context is the age/date of an object and its temporal relation to other items in the archaeological record (as defined by my Google search). As it relates to the digital world, temporal context is comparing a file or artifact to other files and artifacts as it relates to a timeline of system activity. When there is an exchange between attacking and targeted systems the information left on the targeted network will be related. The information will be very closely related within a short timeframe. Temporal Context can also be seen in my post Finding the Initial Infection Vector. The attack activity I first identified was at 10/16/2011 6:50:09 PM and I traced it back to 10/8/2011 23:34:10. This was an eight day timeframe where all the attack vector artifacts were present on the system. It’s a short timeframe when you take into consideration the system had been in use for years. The timeframe grows even smaller when you only look at the attack vector artifacts (exploit, payload, and delivery mechanisms). Temporal Context will hold true for any attack resulting in the attack vector artifacts all occurring within a short timeframe.

What Are Attack Vector Artifacts?


In my previous post (Attack Vector Artifacts) I explained what an attack vector is and the three components it consists of. I think it’s important to briefly revisit the definition and components. An attack vector is a path or means somebody can use to gain access to a network/system in order to deliver a payload or malicious outcome. Based on that definition, an attack vector can be broken down into the following components: delivery mechanisms, exploit, and payload. The diagram below shows their relationship.

Attack Vector Model

At the core is the delivery mechanism which sends the exploit to the network or system. The mechanism can include email, removable media, network services, physical access, or the Internet. Each one of those delivery mechanisms will leave specific artifacts on a network and/or system indicating what initiated the attack.

The purpose of the inner delivery mechanism is to send the exploit. An exploit is something that takes advantage of a vulnerability. Vulnerabilities could be present in a range of items: from operating systems to applications to databases to network services. When vulnerabilities are exploited it leaves specific artifacts on a network/system and those artifacts can identify the weakness targeted. To see what I mean about exploit artifacts you can refer to the ones I documented for Java (CVE-2010-0840 Trusted Methods and CVE-2010-0094 RMIConnectionImpl) , Adobe Reader (CVE-2010-2883 PDF Cooltype), Windows (Autoplay and Autorun and CVE 2010-1885 Help Center), and social engineering (Java Signed Applet Exploit Artifacts).

A successful exploit may result in a payload being sent to the network or system. This is what the outer delivery mechanism is for. If the payload has to be sent to then there may be artifacts showing this activity. One example can be seen in the system I examined in the post Finding the Initial Infection Vector. The Java exploit used the Internet to download the payload and there could have been indications of this in logs on the network. I said “if the payload has to be sent” because there may be instances where the payload is a part of the exploit. In these cases there won’t be any artifacts.

The last component in the attack vector is the desired end result in any attack; to deliver a payload or malicious outcome to the network/system. The payload can include a number of actions ranging from unauthorized access to denial of service to remote code execution to escalation of privileges. The payload artifacts left behind will be dependent on what action was taken.

Compromise Root Cause Analysis Model


To identify the root cause of an attack you need to understand the exploit, payload, and delivery mechanisms artifacts that are uncovered during an examination. The Attack Vector Model does an outstanding job making sense of the artifacts by categorizing them. The model makes it easier to understand the different aspects of an attack and the artifacts that are created by the attack. I’ve been using the model for the past few years to get a better understanding about different types of attacks and their artifacts. Despite the model’s benefits for training and research purposes, I had to extend it in order to use it for investigative purposes by adding two additional layers (source and indicators). The end result is the Compromise Root Cause Analysis Model as shown below.


Compromise Root Cause Analysis Model

At the core of the model is the source of the attack. The source is where the attack originated from. Attacks can originate from outside or within a network; it all depends on who the attacker is. An external source is anything residing outside the control of an organization or person. A few examples are malicious websites, malicious advertisements on websites, or email. On the opposite end are internal attacks which are anything within the control of an organization or person. A few examples include infected removable media and malicious insiders. The artifacts left on a network and its systems can be used to tell where the attack came from.

The second layer added was indicators. The layer is not only where the information and artifacts about how the attack was detected would go but it also encompasses all of the artifacts showing the post compromise activity. A few examples of post compromise activity includes: downloading files, malware executing, network traversal, or data exfiltration. The layer is pretty broad because it groups the post compromise artifacts to make it easier to spot the attack vector artifacts (exploit, payload, and delivery mechanisms).

Compromise Root Cause Analysis Model In Action


The Compromise Root Cause Analysis Model is a way to organize information and artifacts to make it easier to answer questions about an attack. More specifically to answer: how and when did the compromise occur? Information or artifacts about the compromise are discovered by completing examination steps against any relevant data sources. The model is only used to organize what is identified. Modeling discovered information is an ongoing process during an examination. The approach to using the model is to start at the indicators layer then proceed until the source is identified.

The first information to go in the indicators layer is what prompted the suspicion that an attack occurred. Was there an IDS alert, malware indications, or intruder activity. The next step is to start looking for post compromise activity. There will be more artifacts associated with the post compromise then there will be for the attack vectors. While looking at the post compromise artifacts keep an eye out for any attack vector artifacts. The key is to look for any artifacts resembling a payload or exploit. Identifying the payload can be tricky because it may resemble an indicator. Take a malware infection as an example. At times an infection only drops one piece of malware on the system while at other times a downloader is dropped which then downloads additional malware. In the first scenario the single malware is the payload and any artifacts of the malware executing is also included in the payload layer. In the second scenario the additional malware is indicators that an attack occurred. The dropper is the payload of the attack. See what I mean; tricky right? Usually I put any identified artifacts in the indicators layer until I see payload and exploit information that makes me move it into the payload layer.

After the payload is identified then it’s time to start looking for the actual payload and its artifacts. The focus needs to be on the initial artifacts created by the payload. Any addition artifacts created by the payload should be lumped into the indicators layer. To illustrate let’s continue to use the malware scenario. The single malware and any indications of it first executing on the system would be organized in the payload layer. However, if the malware continued to run on the system creating additional artifacts – such as modifying numerous files on the system -then that activity goes into the indicators layer.

The outer delivery mechanism is pretty easy to spot once the payload has been identified. Just look at the system activity around the time the payload appeared to see it. This is the reason why the payload layer only contains the initial payload artifacts; to make it easier to see the layers beneath it.

Similar to the delivery mechanism, seeing the exploit artifacts is also done by looking at the system activity around the payload and what delivered the payload to the system. The exploit artifacts may include: the exploit itself, indications an exploit was used, and traces a vulnerable application was running on the system.

The inner delivery mechanism is a little tougher to see once the exploit has been identified. You may have a general idea about where the exploit came from but actually finding evidence to confirm your theory requires some leg work. The process to find the artifacts is the same; look at the system activity around the exploit and inspect anything of interest.

The last thing to do is to identify the source. Finding the source is done a little different then finding the artifacts in the other layers. The previous layers require looking for artifacts but with the source layer it involves spotting when the attack artifacts stop. Usually there is a flurry of activity showing the delivery mechanisms, exploit, and payload and at some point the activity just stops. In my experiences, this is where the source of the attack is located. As soon as the activity stops then everything before the last identified artifact should be inspected closely to see if the source can be found. In some instances the source can be spotted while in others it’s not as clear. Even if the source cannot be identified at least some avenues of attack can be ruled out based on the lack of supporting evidence. Lastly, if the source points to an internal system then the whole root cause analysis process starts all over again.

Closing Thoughts


I spent my personal time over the past few years helping combat malware. One thing I always do is determine the attack vector so I could at least provide sound security recommendations. I used the compromise root cause analysis process to answer the questions “how” and “when” which thus enabled me to figure out the attack vector. Besides identifying the root of a compromise there are a few other benefits to the process. It’s scalable since it can be used against a single system or a network with numerous systems. Artifacts located from different data sources across a network are organized to show the attack vector more clearly. Another benefit is the process uses layers. Certain layers may not have any artifacts or could be missing artifacts but the ones remaining can still be used to identify how the compromised occurred. This is one of the reasons I’ve been able to figure out how a system was infected even after people took attempts to remove the malware while in the process destroying the most important artifacts showing how the malware got there in the first place.

Computers Don’t Get Sick – They Get Compromised

$
0
0
Security awareness campaigns have done an effective job of educating people about malware. The campaigns have even reached the point to where if people hear certain words they see images in their minds. Say viruses then pictures of a sick computer pops into their minds. Say worms then there’s an image of a computer with critters and germs crawling all over it. People from all walks of life have been convinced malware is similar to real life viruses; the viruses that make things sick. This point of view can be seen at all levels within organizations to family members to the average Joe who walks into the local computer repair shop to the person responsible for dealing with an infected computer. It’s no wonder when malware ends up on a computer people are more likely to think about ER then they are CSI. More likely to do what they can to make the “sickness” go away then they are to figure out what happened. To me people’s expectations about what to do and the actions most people take seems to resemble more like how we deal with the common cold. The issue with this is that computers don’t get sick – they get compromised.

Security awareness campaigns need to move beyond imagery and associations showing malware as something that affects health. Malware should instead be called what it is; a tool. A tool someone is using in an effort to take something from us, our organizations, our families, and our communities. Taking anything they can whether it’s money, information, or computer resources. The burglar picture is a more accurate illustration about what malware is than any of the images showing a “sick” computer. It’s a tool in the hands of a thief. This is the image we need people to picture when they hear the words: malware, viruses, or worms. Those words need to be associated with tools used by criminals and tools used by hostile entities. Maybe then their expectations will change about malware on their computer or within their network. Malware is not something that needs to be “made better” with a trip to the ER but something we need to get to the bottom of to better protect ourselves. It’s not something that should be made to go away so things can go on as normal but something we need to get answers and intelligence from before moving forward. People need to associate malware with going home one day and finding burglary tools sitting in their living room. Seeing the tools in their house should make them want to ask: what happened, how this occurred, and what was taken before they ask when they can continue on as normal.

Those entrusted with dealing with malware on computers and networks need to picture malware the same way. It’s not some cold where we keep throwing medicine at it (aka antivirus scan after antivirus scan). It’s a tool someone placed there to do a specific thing. Making the malware go away is not the answer; the same way that making the tools in the living room disappear doesn’t address the issue. Someone figured out a way to put a tool on the computer and/or network and it’s up to us to figure out how. The tool is a symptom of a larger issue and the intelligence we can learn from answering how the malware got onto a system can go a long way in better protecting the ones relying on our expertise. We need to perform analysis on the systems in order to get to the compromise’s root cause.

The approach going forward should not be to continue with the status quo. The status quo of doing what it takes to make the “sickness” go away without any other thought about answering the questions “how”, “when”, and “what”. Those tasked with dealing with a malware infected computer should no longer accept the status quo either. Removing the malware without any investigative actions to determine the “how”, “when”, and “what”. The status quo views malware on a computer as if the computer is somehow “sick”. It’s time to change the status quo to make it reflect what malware on a computer actually is. The computer isn’t “sick” but compromised.

Detect Fraud Documents 360 Slides

$
0
0
I recently had the opportunity to attend the SANs Digital Forensics and Incident Response summit in Austin Texas. The summit was a great con; from the outstanding presentations to networking with others from the field. I gave a SANs 360 talk about my technique for finding fraudulent word documents (I previously gave a preview about my talk). I wanted to release my slide deck for anyone who wanted to use it as a reference before my paper is completed. You can grab it from my Google sites page listed as “SANs 360 Detect Frauduelent Word Documents.pdf”.

For those who were unable to attend the summit can still read all of the presentations. SANS updated their Community Summit Archives to include the Forensics and Incident Response Summit 2012. I highly recommend checking out the work shared by others; a lot of it was pretty amazing.

Metasploit The Penetration Testers Guide Book Review

$
0
0

A penetration test is a method to locate weaknesses in an organization’s network by simulating how an attacker may circumvent the security controls. The Preface indicated Metasploit The Penetration Tester’s Guide was written specifically so “readers can become competent penetration testers”. The book further goes on to describe a penetration tester as someone who is able to find ways in which a “hacker might be able to compromise an organization’s security and damage the organization as a whole”. I’ve occasionally seen people talk about the book favorably but their comments were as it related to penetration testing. I wanted to review Metasploit The Penetration Tester’s Guide from a different angle; from the Digital Forensic and Incident Response (DFIR) perspective. As a DFIR professional it is important to not only understand the latest attack techniques but it’s equally important to be aware of what artifacts are left by those techniques. This is the perspective I used when reviewing the book and I walked away thinking. If you want to bring your Digital Forensic and Incident Response skills to the next level then throw Metasploit in your toolbox and work your way through this book.

From Methodology to Basics to Exploitation


The book starts out discussing the various phases to a penetration test which were: pre-engagement interactions, intelligence gathering, threat modeling, exploitation, and post exploitation. After covering the methodology there was an entire chapter dedicated to Metasploit basics. I liked how the basics were covered before diving into the different ways to perform intelligence gathering with the Metasplot framework. Not only did the intelligence gathering cover running scans using the Metasploit built-in scanners but it also discussed running scans with nmap and then building a database with Metasploit to store the nmap scans. Before getting into exploitation an entire chapter was dedicated to using vulnerability scanners (Nessus and Nexpose) to identify vulnerabilities in systems. After Chapter 4 the remainder of the book addresses exploitation and post-exploitation techniques. I liked how the book discussed simpler attacks before leading up to more advanced attacks such as client-side, spear phishing, web, and SQL injection attacks. The book even talked about some advanced topics such as building your own Metasploit module and creating your own exploits. I think the book fulfilled the reason for which it was designed: to “teach you everything from the fundamentals of the Framework to advanced techniques in exploitation”.

Prepare, Prepare, and Prepare


Appendix A in the book walks you through setting up some target machines. One of which is a vulnerable Windows XP box running a web server, SQL server, and a vulnerable web application. Setting up the target machines means you can try out the attacks as you work your way through the book. I found it a better learning experience to try things out as I read about them. One addition benefit to this is that it provides you with a system to analyze. You can attack the system then examine afterwards to see what artifacts were left behind. I think this is a great way to prepare and improve your skills to investigate different kinds of compromises. Start out with simple attacks before proceeding to the more advanced attacks.

This is where I think this book along with Metasploit can bring your skills to the next level. There are numerous articles about how certain organizations were compromised but the articles never mention what artifacts were found indicating how the compromise occurred. Does the following story sound familiar? Media reports said a certain organization was compromised due to a targeted email that contained a malicious attachment. The reports never mentioned what incident responders should keep an eye out for nor does it provide anything about how to spot this attack vector on a system. To fill in these gaps we can simulate the attack against a system to see for ourselves how the attack looks from a digital forensic perspective. Spear-phishing attack vector is covered on page 137 and the steps to conduct the attack is very similar to how those organizations are compromised. The simulated attacks don’t have to stop at spear phishing either since the following could also be done: Java social engineering (page 142), client-side web exploits also known as drive-bys (page 146), web jacking (page 151), multipronged attack (page 153), or pivoting onto other machines (page 89) are a few possibilities one could simulate against the targeted machines. It's better to prepare ourselves to see these attacks in advanced then it is to wait until we are tasked with analyzing a compromised system.

Where’s the Vulnerability Research


Metasploit The Penetration Tester’s Guide is an outstanding book and is a great resource for anyone wanting to better understand how attacks work. However, there was one thing I felt the book was missing. The process to identify and research what vulnerabilities are present in specific software you want to exploit. The book mentions how Metasploit exploits can be located by keyword searches but it doesn’t go into detail about how to leverage online resources to help figure out what exploits to use. A search can be done online for a program/service name and version to list all discovered vulnerabilities in that program. Also, there is additional information explaining what a successful exploit may result in such as remote code execution or a denial of service. This approach has helped me when picking what vulnerabilities to go after and I thought a book trying to make competent penetration testers would have at least mentioned it.

Four Star Review


If someone wants to know how to better secure a system then they need to understand how the system can be attacked. If someone wants to know how to investigate a compromised system then they need to understand how attacks work and what those attacks look like on a system. As DFIR professionals it is extremely important for us to be knowledgeable about different attacks and what artifacts those attacks leave behind. This way when we are looking at a system or network it’s easier to see what caused the compromise; a spear phish, drive-by, SQL injection, or some other attack vector. I think the following should be a standard activity for anyone wanting to investigate compromises. Pick up Metasploit The Penetration Tester’s Guide, add Metasploit to your toolbox, and work your way through the material getting shells on test systems. You will not only have a solid understanding about how attacks work but you will pick up some pen testing skills along the way. Overall I gave Metasploit The Penetration Tester’s Guide a four star review (4 out of 5).

Combining Techniques

$
0
0
“You do intrusion and malware investigations, we do CP and fraud cases” is a phrase I saw Harlan mention a few times on his blog. To me the phrase is more about how different the casework is; about how different the techniques are for each type of case. Having worked both fraud and malware cases I prefer to focus on what each technique has to offer as opposed to their differences. How parts of one technique can be beneficial to different types of cases. How learning just a little bit about a different technique can pay big dividends by improving your knowledge, skills, and process that you can use on your current cases. To illustrate I wanted to contrast techniques for malware and fraud cases to show how they help one another.

Program Execution


Malware eventually has to run and when it does execute then there may be traces left on a system. Understanding program execution and where these artifacts are located is a valuable technique for malware cases. Examining artifacts containing program execution information is a quick way to find suspicious programs. One such artifact is prefetch files. To show their significance I’m parsing them with Harlan’s updated pref.pl script. Typically I start examining prefetch files by first looking at what executables ran on a system and where they executed from. I saw the following suspicious programs looking at the output from the command “pref.exe -e -d Prefetch-Folder”.

TMP77E.EXE-02781D7C.pf Last run: Fri Mar 12 16:29:05 2010 (1)
\DEVICE\HARDDISKVOLUME1\DOCUME~1\ADMINI~1\LOCALS~1\TEMP\TMP77E.EXE

TMPDC7.EXE-2240CBB3.pf Last run: Fri Mar 12 16:29:07 2010 (1)
\DEVICE\HARDDISKVOLUME1\DOCUME~1\ADMINI~1\LOCALS~1\TEMP\TMPDC7.EXE

UPDATE.EXE-0825DC41.pf Last run: Fri Mar 12 16:28:57 2010 (1)
\DEVICE\HARDDISKVOLUME1\DOCUMENTS AND SETTINGS\ADMINISTRATOR\DESKTOP\UPDATE.EXE

ASD3.TMP.EXE-26CA54B1.pf Last run: Fri Mar 12 16:34:49 2010 (1)
\DEVICE\HARDDISKVOLUME1\DOCUME~1\ADMINI~1\LOCALS~1\TEMP\ASD3.TMP.EXE

ASD4.TMP.EXE-2740C04A.pf Last run: Fri Mar 12 16:34:50 2010 (1)
\DEVICE\HARDDISKVOLUME1\DOCUME~1\ADMINI~1\LOCALS~1\TEMP\ASD4.TMP.EXE

DRGUARD.EXE-23A7FB3B.pf Last run: Fri Mar 12 16:35:26 2010 (2)
\DEVICE\HARDDISKVOLUME1\PROGRAM FILES\DR. GUARD\DRGUARD.EXE

ASD2.TMP.EXE-2653E918.pf Last run: Fri Mar 12 16:34:27 2010 (1)
\DEVICE\HARDDISKVOLUME1\DOCUME~1\ADMINI~1\LOCALS~1\TEMP\ASD2.TMP.EXE

ASR64_LDM.EXE-3944C1CE.pf Last run: Fri Mar 12 16:29:06 2010 (1)
\DEVICE\HARDDISKVOLUME1\DOCUME~1\ADMINI~1\LOCALS~1\TEMP\ASR64_LDM.EXE

These programs stood out for a few different reasons. First I noticed the path they executed from was a temporary folder in a user’s profile. Unusual file paths are one way to spot malware on a system. The other thing I noticed is that some of the programs only executed once. This behavior resembles how downloaders and droppers work. Their sole purpose is to execute once to either download additional malware or install malware. The last dead giveaway is they all executed within a few minutes of each other. The first sweep across the prefetch files netted some interesting programs that appear to be malicious. The next thing to look at is the individual prefetch files to see what file handles were open when the program ran. The TMP77E.EXE-02781D7C.pf prefetch file showed something interesting as shown below (the command used was “pref.pl -p -i -f TMP77E.EXE-02781D7C.pf”).

EXE Name : TMP77E.EXE
Volume Path : \DEVICE\HARDDISKVOLUME1
Volume Creation Date: Fri Nov 2 08:56:57 2007 Z
Volume Serial Number: 6456-B1FD

\DEVICE\HARDDISKVOLUME1\WINDOWS\SYSTEM32\NTDLL.DLL
\DEVICE\HARDDISKVOLUME1\WINDOWS\SYSTEM32\KERNEL32.DLL
\DEVICE\HARDDISKVOLUME1\WINDOWS\SYSTEM32\UNICODE.NLS
*****snippet*****


EXEs found:

\DEVICE\HARDDISKVOLUME1\DOCUME~1\ADMINI~1\LOCALS~1\TEMP\TMP77E.EXE
\DEVICE\HARDDISKVOLUME1\WINDOWS\SYSTEM32\NET.EXE
\DEVICE\HARDDISKVOLUME1\WINDOWS\SYSTEM32\SC.EXE
\DEVICE\HARDDISKVOLUME1\DOCUME~1\ADMINI~1\LOCALS~1\TEMP\ASR64_LDM.EXE

DAT files found:

\DEVICE\HARDDISKVOLUME1\DOCUMENTS AND SETTINGS\ADMINISTRATOR\LOCAL SETTINGS\TEMPORARY INTERNET FILES\CONTENT.IE5\INDEX.DAT
\DEVICE\HARDDISKVOLUME1\DOCUMENTS AND SETTINGS\ADMINISTRATOR\COOKIES\INDEX.DAT
\DEVICE\HARDDISKVOLUME1\DOCUMENTS AND SETTINGS\ADMINISTRATOR\LOCAL SETTINGS\HISTORY\HISTORY.IE5\INDEX.DAT

Temp paths found:

\DEVICE\HARDDISKVOLUME1\DOCUME~1\ADMINI~1\LOCALS~1\TEMP\TMP77E.EXE
\DEVICE\HARDDISKVOLUME1\DOCUMENTS AND SETTINGS\ADMINISTRATOR\LOCAL SETTINGS\TEMPORARY INTERNET FILES\CONTENT.IE5\INDEX.DAT
\DEVICE\HARDDISKVOLUME1\DOCUMENTS AND SETTINGS\ADMINISTRATOR\LOCAL SETTINGS\TEMPORARY INTERNET FILES\CONTENT.IE5\M20M2OXX\READDATAGATEWAY[1].HTM
\DEVICE\HARDDISKVOLUME1\DOCUME~1\ADMINI~1\LOCALS~1\TEMP\ASR64_LDM.EXE

The pref.pl file handle portion to the output was trimmed to make it easier to read but I left in the intelligence provided by the script through its filters. The filters highlight file handles containing exes, dats, and temporary folders. The exe filter shows in additional to a handle to the TMP77E.EXE file there were handles to SC.EXE, NET.EXE, and ASR64_LDM.EXE. SC.EXE is a Windows program for managing services including creating new services while NET.EXE is a Windows program for doing various tasks including starting services. ASR64_LDM.EXE was another suspicious program that ran on the system after TMP77E.EXE. The file handles inside each prefetch file of interest provided additional information which is useful during a malware case.

Program execution is vital for malware cases and I saw how the same technique can apply to fraud cases. On fraud cases a typical activity is to identify and locate financial data. At times this can be done by running keyword searches but most of the time (at least for me) the actual financial data is unknown. What I mean by this is a system is provided and it’s up to you to determine what data is financial. This is where the program execution technique comes into play. The programs that ran on the system can be reviewed to provide leads about what kind of financial data may be present on the system. Using the first sweep across the prefetch files I located these interesting programs (command used was “pref.exe -e -d Prefetch-Folder”). Note: the system being looked at is not from a fraud case but it still demonstrates how the data appears.

WINWORD.EXE-C91725A1.pf Last run: Tue Jul 10 16:42:26 2012 (42)
\DEVICE\HARDDISKVOLUME2\PROGRAM FILES\MICROSOFT OFFICE\OFFICE12\WINWORD.EXE

ACROBAT_SL.EXE-DC4293F2.pf Last run: Fri Jun 22 18:14:12 2012 (1)
\DEVICE\HARDDISKVOLUME2\PROGRAM FILES\ADOBE\ACROBAT 9.0\ACROBAT\ACROBAT_SL.EXE

EXCEL.EXE-C6BEF51C.pf Last run: Tue Jul 10 16:30:18 2012 (22)
\DEVICE\HARDDISKVOLUME2\PROGRAM FILES\MICROSOFT OFFICE\OFFICE12\EXCEL.EXE

POWERPNT.EXE-1404AEAA.pf Last run: Thu Jun 21 20:14:52 2012 (22)
\DEVICE\HARDDISKVOLUME2\PROGRAM FILES\MICROSOFT OFFICE\OFFICE12\POWERPNT.EXE

When I look at program execution for fraud cases I look for financial applications, applications that can create financial data, and programs associated with data spoliation. The system didn’t have any financial or data spoliation programs but there were office productivity applications capable of creating financial documents such as invoices, receipts, proposals, etc. These programs were Microsoft Office and Adobe Acrobat and this means the data created on the system is most likely Word, Excel, Powerpoint, or PDFs. The number of executions for each program is also interesting. I look to see what applications are heavily used since it’s a strong indication about what program the subject uses. Notice Adobe only ran once while Word was ran 42 times. Looking at the file handles inside individual prefetch file also contains information relevant to a fraud case. Below are a few sanitized handles I found in the WINWORD.EXE-C91725A1.pf prefetch file (the command used was “pref.pl -p -i -f WINWORD.EXE-C91725A1.pf”).

EXE Name : WINWORD.EXE
Volume Path : \DEVICE\HARDDISKVOLUME2
Volume Creation Date: Fri Aug 26 18:13:26 2011 Z
Volume Serial Number: E4DD-S23A

\DEVICE\HARDDISKVOLUME2\WINDOWS\SYSTEM32\NTDLL.DLL
\DEVICE\HARDDISKVOLUME2\WINDOWS\SYSTEM32\KERNEL32.DLL
\DEVICE\HARDDISKVOLUME2\WINDOWS\SYSTEM32\APISETSCHEMA.DLL
*****snippet*****
\DEVICE\HARDDISKVOLUME4\FORENSICS\RESEARCH\Folder\SANTIZED.DOCX
\DEVICE\HARDDISKVOLUME4\FORENSICS\RESEARCH\Folder\~$SANTIZED.DOCX
\DEVICE\HARDDISKVOLUME2\USERS\USERNAME\APPDATA\LOCAL\TEMP\MSO4F30.TMP
\DEVICE\HARDDISKVOLUME4\FORENSICS\RESEARCH\Folder\SANTIZED 2.DOCX
\DEVICE\HARDDISKVOLUME4\FORENSICS\RESEARCH\Folder\~$SANTIZED 2.DOCX
\DEVICE\HARDDISKVOLUME2\USERS\USERNAME\APPDATA\LOCAL\TEMP\MSO7CF3.TMP
\DEVICE\HARDDISKVOLUME2\USERS\USERNAME\APPDATA\LOCAL\TEMP\20517251.OD
\DEVICE\HARDDISKVOLUME4\FORENSICS\RESEARCH\Folder\SANTIZED 3.DOCX
\DEVICE\HARDDISKVOLUME4\FORENSICS\RESEARCH\Folder\~$SANTIZED 3.DOCX
\DEVICE\HARDDISKVOLUME4\$MFT
\DEVICE\HARDDISKVOLUME2\USERS\USERNAME\APPDATA\LOCAL\MICROSOFT\WINDOWS\TEMPORARY INTERNET FILES\CONTENT.MSO\SANTIZED.JPEG
\DEVICE\HARDDISKVOLUME4\FORENSICS\RESEARCH\Folder\SANTIZED 3.DOCX:ZONE.IDENTIFIER
*****snippet*****

The file handles shows documents stored in the folder FORENSICS\RESEARCH\Folder\ on a different volume were accessed with Word. I think this is significant because not only does it provide filenames to look for but it also shows another storage location the subject may have used. Where ever there is storage accessible to the subject then there’s a chance that is where they are storing some financial data. Also, notice in the output how the last line shows one of the documents was downloaded from the Internet (zone identified alternate data stream).

User Activity


The program execution showed how fraud cases benefited from a technique used in malware cases. Now let’s turn the tables to see how malware cases can benefit from fraud. As I mentioned before most of the times I have to find where financial data is located whether if it’s on the system or in network shares. The best approach I found was to look at artifacts associated with user activity; specifically file, folder, and network share access. My reasoning is if someone is being looked at for committing a fraud and they are suspected of using the computer to commit the fraud then they will be accessing financial data from the computer to carry out the fraud. Basically, I let their user activity show me where the financial data is located and this approach works regardless if the data is in a hidden folder or stored on a network. There are numerous artifacts containing file, folder, and network share access and one of them is link files. To show their significance I’m parsing them with TZWorks LNK Parser Utility. When I examine link files I parse both the Recent and Office/Recent folders. This results in some duplicates but it catches link files found in one folder and not the other. I’ve seen people delete everything in the Recent folder while not realizing the Office\Recent folder exists. I saw some interesting target files, folders, and network shares by running the command “dir C:\Users\Username\AppData\Roaming\Microsoft\Windows\Recent\*.lnk /b /s | lp -pipe -csv > fraud_recent.txt”.

{CLSID_MyComputer}\E:\Forensics\Research\Folder\sanatized.doc
{CLSID_MyComputer}\E:\Forensics\Research\Folder\sanitized 2.doc
{CLSID_MyComputer}\E:\Forensics\Research\Folder\sanitized 3.doc
{CLSID_MyComputer}\C:\Atad\material\sanitized 1.pdf
{CLSID_MyComputer}\F:\Book1.xls
\\192.168.200.55\ share\TR3Secure

The output has been trimmed (only shows target file column) and sanitized since it’s from one of my systems. The link files show files and folders on removable media and a network share has been accessed in addition to a folder not inside the user profile. I’ve used this same technique on fraud cases to figure out where financial data was stored. One time it was some obscure folder on the system while the next time it was a share on a server located on the network.

Tracking user activity is a great way to locate financial data on fraud cases and I saw how this same technique can apply to malware cases. On malware cases it can help answer the question how did the computer become infected. Looking at the user activity around the time of the initial infection can help shed light on what attack vector was used to compromise the system. Did the user access a network share, malicious website, removable media, email attachment, or peer to peer application? The user activity provides indications about what the account was doing that contributed to the infection. On the malware infected system there were only two link files in the Recent folder shown below is the target create time and target name (command used was “dir "F:\Malware_Recent\*.lnk" /b /s | lp -pipe -csv > malware_recent.txt”).

3/12/2010 16:17:04.640 {CLSID_MyComputer}\C:\downloads
3/12/2010 16:18:59.609 {CLSID_MyComputer}\C:\downloads\link.txt

These link files show the user account accessed the downloads folder and the link text file just before the suspicious programs started executing on the system. Looking at this user activity jogged my memory about how the infection occurred. I was researching a link from a SPAM email and I purposely clicked the link from a system. I just never got around to actually examining the system. However, even though the system was infected on purpose examining the user activity on the malware cases I worked has helped answer the question how did the system become infected.

Closing Thoughts


DFIR has a lot of different techniques to deal with the casework we face. Too many times we tend to focus on the differences; the different tools, different processes, and different meanings of artifacts. Focusing on the differences distracts from seeing what the techniques have to offer. What parts of the techniques can strengthen our processes and make us better regardless of what case we are up against. If I didn’t focus on what the techniques had to offer then I would have missed an opportunity. A chance to develop a better DFIR process by combining malware and fraud techniques; a process that I think is far better than if each technique stood on their own.

Malware Root Cause Analysis

$
0
0
The purpose to performing root cause analysis is to find the cause of a problem. Knowing a problem’s origin makes it easier to take steps to either resolve the problem or lessen the impact the next time the problem happens again. Root cause analysis can be conducted on a number of issues; one happens to be malware infections. Finding the cause of an infection will reveal what security controls broke down that let the malware infect the computer in the first place. In this post I’m expanding on my Compromise Root Cause Analysis Model by showing how a malware infection can be modeled using it.

Compromise Root Cause Analysis Revisited


The Compromise Root Cause Analysis Model is a way to organize information and artifacts to make it easier to answer questions about a compromise. The attack artifacts left on a network and/or computer fall into one of these categories: source, delivery mechanism, exploit, payload, and indicators. The relationship between the categories is shown in the image below.


I’m only providing a brief summary about the model but for more detailed information see the post Compromise Root Cause Analysis Model. At the model’s core is the source of the attack; this is where the attack came from. The delivery mechanisms are for the artifacts associated with the exploit and payload being sent to the target. Lastly, the indicators category is for the post compromise activity artifacts. The only thing that needs to be done to use the model during an examination is to organize any relevant artifacts into these categories. I typically categorized every artifact I discover as an indicator until additional information makes me move them to a different category.

Another Day Another Java Exploit


I completed this examination earlier in the year but I thought it made a great case to demonstrate how to determine a malware infection’s origin by using the Root Cause Analysis Model. The examination was kicked off when someone saw visual indicators on their screen that their computer was infected. My antivirus scan against the powered down computer confirmed there was an infection as shown below.


The antivirus scan flagged four files as being malicious. Two binaries (fuo.exe and 329991.exe) were identified as the threat: Win32:MalOb-GR[Cryp]. One cached webpage (srun[1].htm) was flagged as JS:Agent-PK[Trj] while the ad_track[1].htm file was identified as HTML:RedirME-inf[Trj]. A VirusTotal search on the fuo.exe file’s MD5 hash provided more information about the malware.

I mentally categorized the four files as indicators of the infection until it’s proven otherwise. The next examination step that identified additional artifacts was timeline analysis because it revealed what activity was occurring on the system around the time when malware appeared. A search for the files fuo.exe and 329991.exe brought me to the portion of the timeline shown below.


The timeline showed the fuo.exe file was created on the computer after the 329991.exe file. There were also indications that Java executed; the hsperfdata_username file was modified which is one artifact I highlighted in my Java exploit artifact research. I was looking at the activity on the system before the fuo.exe file appeared which is shown below.


The timeline confirmed Java did in fact execute as can be seen by the modification made to its prefetch file. The file 329991.exe was created on the system at 1/15/2012 16:06:22 which was one second after a jar file appeared in the anon user profile’s temporary folder. This activity resembles exactly how an infection looks when a Java exploit is used to download malware onto a system. However, additional legwork was needed to confirm my theory. Taking one look at the jar_cache8544679787799132517.tmp file in JD-GUI was all that I needed. The picture below highlights three separate areas in the jar file.


The first area labeled as 1 shows a string being built where the temp folder (str1) is added to 329991.exe. The second area labeled as 2 first shows the InputStream function sets the URL to read from while the FileOutputStream function writes the data to a file which happens to be str3. Remember that str3 contains the string 329991.exe located inside the temp folder. The last highlighted area is labeled as 3 which is where the Runtime function starts to run the newly created 329991.exe file. The analysis on the jar file confirmed it was responsible for downloading the first piece of malware onto the system. VirusTotal showed that only 8 out of 43 scanners identified the file as a CVE-2010-0840 Java exploit. (for another write-up about how to examine a Java exploit refer to the post Finding the Initial Infection Vector). At this point I mentally categorized all of the artifacts associated with Java executing and the Java exploit under the exploit category. The new information made me move 329991.exe from the indicator to the payload category since it was the payload of the attack.

I continued working the timeline by looking at the activity on the system before the Java exploit (jar_cache8544679787799132517.tmp) appeared on the system. I noticed there was a PrivacIE entry for a URL ending in ad_track.php. PrivacIE entries are for 3rd party content on websites and this particular URL was interesting because Avast flagged the cached webpage ad_track[1].htm. I started tracking the URLs in an attempt to identify the website that served up the 3rd party content. I didn’t need to identify the website per say since I already reached my examination goal but it was something I personally wanted to know. I gave up looking after spending about 10 minutes working my way through a ton of Internet Explorer entries and temporary Internet files for advertisements.


I answered the “how” question but I wanted to make sure the attack only downloaded the two pieces of malware I already identified. I went back in the timeline to when the fuo.exe file was created on the system. I started looking to see if any other files were created on the system but the only activity I really saw involved the antivirus software installed on the system.


Modeling Artifacts


The examination identified numerous artifacts and information about how the system was compromised. The diagram below shows how the artifacts are organized under the Compromise Root Cause Analysis Model.


As can be seen in the picture above the examination did not confirm all of the information about the attack. However, categorizing the artifacts helped make it possible to answer the question how did the system become infected. It was a patching issue that resulted in an extremely vulnerable Java version running on the system. In the end not only did another person get their computer cleaned but they also learned about the importance of installing updates on their computer.


Usual Disclaimer: I received permission from the person I assisted to discuss this case publicly.

Welcome to Year 2

$
0
0
This past week I was vacationing with my family when my blog surpassed another milestone. It has been around for two years and counting. Around my blog’s anniversary I like to reflect back on the previous year and look ahead at the upcoming one. Last year I set out to write about various topics including: investigating security incidents, attack vector artifacts, and my methodology. It shouldn’t be much of a surprise then when you look at the topics in my most read posts from the past year:

1. Dual Purpose Volatile Data Collection Script
2. Finding the Initial Infection Vector
3. Ripping Volume Shadow Copies – Introduction
4. Malware Root Cause Analysis
5. More About Volume Shadow Copies
6. Ripping VSCs – Practitioner Method

Looking at the upcoming year there’s a professional change impacting a topic I’ve been discussing lately. I’m not talking about a job change but an additional responsibility in my current position. My casework will now include a steady dose of malware cases. I’ve been hunting malware for the past few years so now I get to do it on a regular basis as part of my day job. I won’t directly discuss any cases (malware, fraud, or anything else) that I do for my employer. However, I plan to share the techniques, tools, or processes I use. Malware is going to continue to be a topic I frequently discuss from multiple angles in the upcoming year.

Besides malware and any other InfoSec or DFIR topics that have my interest, there are a few research projects on my to-do list. First and foremost is to complete my finding fraudulent documents whitepaper and scripts. The second project is to expand on my current research about the impact virtual desktop infrastructure will have on digital forensics. There are a couple of other projects I’m working on and in time I’ll mention what those are. Just a heads up, at times I’m going to be focusing on these projects so expect some time periods when there isn’t much activity with the blog. As usual, my research will be shared either through my blog or another freely available resource to the DFIR community.

Again, thanks to everyone who links back to my blog and/or publicly discusses any of my write-ups. Each time I come across someone who says that something I wrote helped them in some way makes all the time and work I do for the blog worth the effort. Without people forwarding along my posts then people may not be aware about information that could help them. For this I’m truly grateful. I couldn’t end a reflection post without thanking all the readers who stop by jIIr. Thank you and you won’t be disappointed with what I’m gearing up to release over the next year.

Linkz for Tools

$
0
0
In this Linkz edition I’m mentioning write-ups discussing tools. A range of items are covered from the registry to malware to jump lists to timelines to processes.

RegRipper Updates


Harlan has been pretty busy updating RegRipper. First RegRipper version 2.5 was released then there were some changes to where Regripper is hosted along with some nice new plugins. Check out Harlan’s posts for all the information. I wanted to touch on a few of the updates though. The updates to Regripper included the ability to run directly against volume shadow copies and parse big data. The significance to parsing big data is apparent in his new plugin that parses the shim cache which is an awesome artifact (link up next). Another excellent addition to RegRipper is the shellbags plugin since it parses Windows 7 shell bags. Harlan’s latest post Shellbags Analysis highlights the forensic significance to shell bags and why one may want to look at the information they contain. I think these are awesome updates; now one tool can be used to parse registry data when it used to take three separate tools. Not to be left out the community has been submitting some plugins as well. To only mention a few Hal Pomeranz provided some plugins to extract Putty and WinSCP information and Elizabeth Schweinsberg added plugins to parse different Run keys. The latest RR plugin download has the plugins submitted by the community. Seriously, if you use RegRipper and haven’t checked out any of these updates then what are you waiting for?

Shim Cache


Mandiant’s post Leveraging the Application Compatibility Cache in Forensic Investigations explained the forensic significance of the Windows Application Compatibility Database. Furthermore, Mandiant released the Shim Cache Parser script to parse the appcompatcache registry key in the System hive. The post, script, and information Mandiant released speaks for itself. Plain and simple, it rocks. So far the shim cache has been valuable for me on fraud and malware cases. Case in point, at times when working malware cases programs execute on a system but the usual program execution artifacts (such as prefetch files) doesn’t show it. I see this pretty frequently with downloaders which are programs whose sole purpose is to download and execute additional malware. The usual program execution artifacts may not show the program running but the shim cache was a gold mine. Not only did it reflect the downloaders executing but the information provided more context to the activity I saw in my timelines. What’s even cooler than the shim cache? Well there are now two different programs that can extract the information from the registry.

Searching Virus Total


Continuing on with the malware topic, Didier Stevens released a virustotal-search program. The program will search for VirusTotal reports using a file’s hash (MD5, SHA1, SHA256) and produces a csv file showing the results. One cool thing about the program is it only performs hash searches against Virustotal so a file never gets uploaded. I see numerous uses for this program since it accepts a file containing a list of hashes as input. One way I’m going to start using virustotal-search is for malware detection. One area I tend to look at for malware and exploits are temporary folders in user profiles. It wouldn’t take too much to search those folders looking for any files with an executable, Java archive, or PDF file signatures. Then for each file found perform a search on the file’s hash to determine if VirusTotal detects it as malicious. Best of all, this entire process could be automated and run in the background as you perform your examination.

Malware Strings


Rounding out my linkz about malware related tools comes from the Hexacorn blog. Adam released Hexdrive version 0.3. In Adam’s own words the concept behind Hexdrive is to “extract a subset of all strings from a given file/sample in order to reduce time needed for finding ‘juicy’ stuff – meaning: any string that can be associated with a) malware b) any other category”. Using Hexdrive makes reviewing strings so much easier. You can think of it as applying a filter across the strings to initially see only the relevant ones typically associated with malware. Then afterwards all of the strings can be viewed using something like Bintext or Strings. It’s a nice data reduction technique and is now my first go to tool when looking at strings in a suspected malicious file.

Log2timeline Updates


Log2timeline has been updated a few times since I last spoke about it on the blog. The latest release is version 0.64. There have been quite a few updates ranging from small bug fixes to new input modules to changing the output of some modules. To see all the updates check out the changelog.

Most of the time when I see people reference log2timeline they are creating timelines using either the default module lists (such as winxp) or log2timeline-sift. Everyone does things differently and there is nothing wrong with these approaches. Personally, both approaches doesn’t exactly meet my needs. The majority of the systems I encounter have numerous user profiles stored on them which mean these profiles contain files with timestamps log2timeline extracts. Running a default module list (such as winxp) or log2timeline-sift against the all the user profiles is an issue for me. Why should I include timeline data for all user accounts instead of the one or two user profiles of interest? Why include the internet history for 10 accounts when I only care about one user? Not only does it take additional time for timeline creation but it results in a lot more data then what I need thus slowing down my analysis. I take a different approach; an approach that better meets my needs for all types of cases.

I narrow my focus down to specific user accounts. I either confirm who the person of interest is which tells me what user profiles to examine. Or I check the user profile timestamps to determine which ones to focus on. What exactly does this have to do with log2timeline? The answer lies in the –e switch since it can exclude files or folders. The –e switch can be used to exclude all user profiles I don’t care about. There’s 10 user profiles and I only care about 2 profiles but I only want to run one log2timeline command. No problem if you use the –e switch. To illustrate let’s say I’m looking at the Internet Explorer history on a Windows 7 system with five user profiles: corey, sam, mike, sally b, and alice. I only need to see the browser history for the corey user account but I don’t want to run multiple log2timeline commands. This is where the –e switch comes into play as shown below:

log2timeline.pl -z local -f iehistory -r -e Users\\sam,Users\\mike,"Users\\sally b",Users\\alice,"Users\\All Users" -w timeline.csv C:\

The exclusion switch eliminates anything containing the text used in the switch. I could have used sam instead of Users\\sam but then I might miss some important files such as anything containing the text “sam”. Using a file path limits the amount of data that is skipped but will still eliminate any file or folder that falls within those user profiles (actually anything falling under the C root directory containing the text Users\username). Notice the use of the double back slashes (\\) and the quotes; for the command to work properly this is needed. What’s the command’s end result? The Internet history from every profile stored in the Users folder except for the sam, mike, sally b, alice, and all user profiles is parsed. I know most people don’t run multiple log2timeline commands when generating timelines since they only pick one of the default modules list. Taking the same scenario where I’m only interested in the corey user account on a Windows 7 box check out the command below. This will parse every Windows 7 artifact except for the excluded user profiles (note the command will impact the filesystem metadata for those accounts if the MFT is parsed as well).

log2timeline.pl -z local -f win7 -r -e Users\\sam,Users\\mike,"Users\\sally b",Users\\alice,"Users\\All Users" -w timeline.csv C:\

The end result is a timeline focused only on the user accounts of interest. Personally, I don't use the default module lists in log2timeline but I wanted to show different ways to use the -e switch.

Time and Date Website


Daylight savings time does not occur on the same day each year. One day I was looking around the Internet for a website showing the exact dates when previous daylight savings time changes occurred. I came across the timeanddate.com website. The site has some cool things. There’s a converter to change the date and time from one timezone to another. There’s a timezone map showing where the various timezones are located. A portion of the site even explains what Daylight Savings Time is. The icing on the cake is the world clock where you can select any timezone to get additional information including the historical dates of when Daylight Savings Time occurred. Here is the historical information for the Eastern Timezone for the time period from the year 2000 to 2009. This will be a useful site when you need to make sure that your timestamps are properly taken into consideration Daylight Savings Time.

Jump Lists


The day has finally arrived; over the past few months I’ve been seeing more Windows 7 systems than Windows XP. This means the artifacts available in the Windows 7 operating system are playing a greater role in my cases. One of those artifacts is jump lists and Woanware released a new version of Jumplister which parses them. This new version has the ability to parse out the DestList data and performs a lookup on the AppID.

Process, Process, Process


Despite all the awesome tools people release they won’t be much use if there isn’t a process in place to use them. I could buy the best saws and hammers but they would be worthless to me building a house since I don’t know the process one uses to build a house. I see digital forensics tools in the same light and in hindsight maybe I should have put these links first. Lance is back blogging over at ForensicKB and he posted a draft to the Forensic Process Lifecycle. The lifecycle covers the entire digital forensic process from the Preparation steps to triage to imaging to analysis to report writing. I think this one is a gem and it’s great to see others outlining a digital forensic process to follow. If you live under a rock then this next link may be a surprise but a few months back SANS released their Digital Forensics and Incident Response poster. The poster has two sides; one outlines various Windows artifacts while the other outlines the SANs process to find malware. The artifact side is great and makes a good reference hanging on the wall. However, I really liked seeing and reading about the SANs malware detection process since I’ve never had the opportunity to attend their courses or read their training materials. I highly recommend for anyone to get a copy of the poster (paper and/or electronic versions). I’ve been slacking updating my methodology page but over the weekend I updated a few things. The most obvious is adding links to my relevant blog posts. The other change and maybe less obvious is I moved around some examination steps so they are more efficient for malware cases. The steps reflect the fastest process I’ve found yet to not only find malware on a system but to determine how malware got there. Just an FYI, the methodology is not only limited to malware cases since I use the same process for fraud and acceptable use policy violations.

Man versus AntiVirus Scanner

$
0
0
Knowing what programs ran on a system can answer numerous questions about what occurred. What was being used to communicate, what browsers are available to surf the web, what programs can create documents, were any data spoliation programs ran, or is the system infected. These are only a few of the questions that can be answered by looking at program execution. There are different artifacts showing program execution; one of which is the application compatibility cache. Mandiant’s whitepaper Leveraging the Application Compatibility Cache in Forensic Investigations (blog post is here and paper is here) explains what the cache is in detail and why it’s important to digital forensics. One important aspect about the cache is it stores information about files such as names, size, and last modified times; all of which may be useful during a digital forensic examination. The application compatibility cache has provided additional information I wouldn’t have known about without it. As such I’m taking some time to write about this important new artifact.

I wanted to highlight the significance of the cache but I didn’t want to just regurgitate what Mandiant has already said. Instead I’m doing the DFIR equivalent of man versus the machine. I’m no John Henry but like him we are witnessing the impact modernization has on the way people do their jobs. One such instance is the way people try to determine if a system is infected with malware. A typical approach is to scan a system with antivirus software to determine if it is infected. There is a dependency on the technology (antivirus software) to do the work and in essence the person is taken out of the process. Seems very similar to what John Henry witnessed with the steam powered hammer replacing the human steel drivers. John Henry decided to demonstrate man’s might by taking the steam powered hammer head on in a race. I opted to do the same, to take on one of my most reliable antivirus scanners (Avast) in a head on match to see who can first locate and confirm the presence of malware on a system. I didn’t swing a hammer either. My tools of choice were RegRipper with the new appcompatcache plugin to parse the application compatibility cache along with the Sleuthkit and Log2timeline to generate a timeline containing filesystem metadata. Maybe, just maybe in some distant future in IT and security shops across the land people will be singing songs about the race of the century. When Man took on the Antivirus Scanner.

The Challenge


The challenge was to find malware that an organization somewhere in the land is currently facing. Before worrying about what malware to use I first configured the test system. The system was a Windows XP fresh install with Service Pack 3. I only installed Adobe Reader version 9.3 and Java version 6 update 27. These applications were chosen to make it easier to infect the system through a drive-by. I wanted to use unknown malware as a way to level the playing field; I didn’t need nor want any advantages over the antivirus scanner. To find the malware I looked at the recently listed URLs on the Malware Domain List to find any capable of doing a drive-by. I found two potential URLs as shown below.


The first URL pointed to a Blackhole exploit pack. I entered the URL into Internet Explorer and after waiting for a little bit the landing page appeared as captured below.


I gave Blackhole some more time to infect the computer before I entered the second URL. That was when I saw the first indication the system was successfully infected with an unknown malware.


The race was now officially on. Whoever finds the malware and any other information about the malware first wins.

On Your Mark, Get Set


I mounted the system to my workstation using FTK Imager in order for tools to run against it. I downloaded and installed the latest Avast version followed by updating to the latest virus signature definitions. I configured Avast to scan the mounted image and all that was left was to click “Scan”. With my challenger all set I made sure I had the latest RegRipper Appcompatcache plugin. Next I fired up the command prompt and entered the following command:

rip.pl –p appcompatcache –r F:\Windows\System32\config\system > C:\appcompt.txt

The command is using RegRipper’s command-line version and says to run the appcompatcache plugin against the system registry hive in the mounted image’s config folder. To make it easier to review the output I redirected it to a text file.

My challenger is all set waiting at the starting line. I’m all set just waiting for one little word.

Go!


The Avast antivirus scan was started as I pressed enter to run the RegRipper’s appcompatcache plugin against the system registry hive.

0 minutes 45 seconds


I opened the text file containing the parsed application compatibility cache. One cool thing about the plugin is that Harlan highlights any executables in a temporary folder. In the past I quickly found malware by looking at any executables present in temp folders so I went immediately to the end of the output. I found the following suspicious files which I inspected closer.

Temp paths found:

C:\Documents and Settings\Administrator\Local Settings\Temp\gtbcheck.exe
C:\Documents and Settings\Administrator\Local Settings\Temp\install_flash_player_ax.exe
C:\Documents and Settings\Administrator\Local Settings\Temp\install_flashplayer11x32ax_gtbd_chrd_dn_aih[1].exe
C:\Documents and Settings\Administrator\Local Settings\Temp\gccheck.exe
C:\Documents and Settings\Administrator\Local Settings\Temporary Internet Files\Content.IE5\4967GLU3\install_flashplayer11x32ax_gtbd_chrd_dn_aih[1].exe
C:\Documents and Settings\Administrator\Local Settings\Temp\install_flashplayer11x32ax_gtbd_chrd_dn_aih[1].bat

3 minutes 4 seconds


My hopes of a quick win came crashing down when I found out the executables in the temporary folders were no longer present on the system. I went back to the beginning of the application compatibility cache’s output and started working my way through each entry one at a time. Avast was scanning the system at a fast pace because the image was so small.

5 minutes 10 seconds


Avast was still scanning the system but it still didn’t find the malware. That was good news for me because I found another suspicious entry in the application compatibility cache.

C:\Documents and Settings\Administrator\Local Settings\Application Data\armfukk.exe
ModTime: Tue Aug 21 20:34:04 2012 Z
UpdTime: Tue Aug 21 20:38:03 2012 Z
Size : 495616 bytes

The file path drew my attention to the program and a check on the system showed it was still there. I quickly uploaded armfukk.exe to VirusTotal as stared at the Avast scan waiting to see if it would flag it before the VirusTotal scan completed.


VirusTotal delivered the verdict: 9 out of 42 antivirus scanners detected the armfukk.exe file as malware. Going head to head against Avast I located a piece of malware in about 5 minutes while Avast was still scanning. As you probably expected Avast still didn’t flag any files as being malicious.

Avast was still running the race as it kept scanning the system. I continued my examination by turning to my next tool of choice; a timeline. A timeline would provide a wealth of information by showing the activity around the time the armfukk.exe file was created on the system. I ran the following Sleuthkit command to create a bodyfile containing the filesystem metadata:

fls.exe -m C: -r \\.\F: > C:\bodyfile

9 minutes 30 seconds


Avast was still chugging along scanning but it still didn’t flag any files. The bodyfile was finally created but I needed to convert it into a more readable format. I wanted the timeline in log2timeline’s csv format so I next ran the command:

log2timeline.pl -z local -f mactime -w timeline.csv C:\bodyfile

11 minutes 22 seconds


I imported the timeline into Excel and sorted the output. Just as I was getting ready to search on the “armfukk.exe” keyword Avast finally completed its scan with zero detections.


Shortly There After


The race was over but I wasn’t basting in the glory of winning. I wanted to know how the malware actually infected the computer since I was so close to getting the answer. I searched on the armfukk.exe filename and found the entry showing when the file was created on the system.


There was activity showing Java was running and five seconds before the armfukk.exe file was created I came across an interesting file in the Java cache. VirusTotal gave me all the confirmation I needed.


Moral of the Story


As I said before, maybe, just maybe in some distant future in IT and security shops across the land people will be singing songs about the race of the century. Remembering the day when man demonstrated they were needed in the process to locate malware on a system. Putting antivirus technology into perspective as a tool; a great tool to have available in the fight against malware. Remembering the day when man stood up and said "antivirus technology is not a replacement for having a process to respond to malware incidents nor is it a replacement for the people who implement that process".

From Malware Analysis to Portable Clam AV

$
0
0
Malware forensics can answer numerous questions. Is there malware on the system, where is it, how long has it been there, and how did it get there in the first place. Despite all the questions malware forensics can solve there are some that it can’t. What is the malware’s purpose, what is its functionality, and is it capable of stealing data. To answer these questions requires malware analysis. Practical Malware Analysis defines malware analysis as “the art of dissecting malware to understand how it works, how to identify it, and how to defeat or eliminate it”. I’ve been working on improving my malware analysis skills while at the same time thinking about the different ways organizations can benefit from the information gained by analyzing malware. One such benefit is empowering the help desk to combat malware. Everyday help desks are trying to find malware on computers using antivirus products lacking signatures to detect it. Analyzing malware can provide enough information to build a custom antivirus signature to provide the help desk with a capability to find it until the commercial antivirus signatures catch up. In this post I’m going through the process; from analyzing malware to creating a custom antivirus signature to using the signature in the portable apps ClamAV version.

The work presented in this post was originally put together for my hands on lab for a Tr3Secure meet-up. Also, the sample used was obtained from Contagio’s post APT Activity Monitor / Keylogger.

Disclaimer:

I’m not a malware analyst. I’m an information security and digital forensic practitioner who is working on improving my malware analysis skills. As such for anyone looking to be more knowledgeable on the subject then I highly recommend the books Practical Malware Analysis and the Malware Analyst's Cookbook.

Static Analysis


Static Analysis is when the malware is examined without actually running it. There are different static analysis steps to extract information; the two I’m discussing are: reviewing strings and reviewing the import table.

Reviewing Strings


Strings in malware can provide clues about the program and I find them helpful since it makes me more aware about malware’s potential functionality. However, conclusions cannot be drawn by solely looking at the strings. I usually first run HexDive on a sample to filter the strings typically associated with malware followed by running Strings to make sure I see everything.

Below is the Hexdrive command running against AdobeInfo.exe and a snippet from its output.

C:\> Hdive.exe C:\Samples\AdobeInfo.exe

CreateFileA
SetFileAttributesA
CreateDirectoryA
GetCurrentDirectoryA
GetWindowTextA
GetForegroundWindow
GetAsyncKeyState
GetStartupInfoA
[Up]
[Num Lock]
[Down]
[Right]
[UP]
[Left]
[PageDown]
[End]
[Del]
[PageUp]
[Home]
[Insert]
[Scroll Lock]
[Print Screen]
[WIN]
[CTRL]
[TAB]
[F12]
[F11]

There were numerous Windows API function names in the strings and looking the functions up in Practical Malware Analysis’s Appendix A (commonly encountered Windows functions) provides some clues. The following are three function names and why they may be relevant:

     - CreateFileA: creates new or opens existing file

     - GetForegroundWindow: returns a handle to a window currently in the foreground of the desktop. Function is commonly used by keyloggers to determine what window the user is entering keystrokes in

     - GetAsyncKeyState: used to determine whether a particular key is being pressed. Function is sometimes used to implement a keylogger

The other interesting strings were the characters associated with a keyboard such as [Down] and [Del]. The combination of the API names and keyword characters indicate the malware could have some keylogging functionality.

Below is the Strings command running against AdobeInfo.exe and a snippet from its output.

C:\>Strings.exe C:\Samples\AdobeInfo.exe

---- %04d%02d%02d %02d:%02d:%02d ----------------
\UpdaterInfo.dat
\mssvr
The Active Windows Title: %s

In addition to the strings extracted with HexDrive, Strings revealed some other text that didn’t become clear until later in the examination.

Reviewing the Import Table


Imports are functions used by one program that are actually stored in a different program, such as code libraries that contain functionality common to many programs”. Looking at functions imported by a program provides better information about a malware’s functionality than solely relying on its strings. I used CFF Explorer to review the import table as shown in the screen shot below.


The import table showed three DLLs which were kernel32.dll, user32.dll, and msvcrt.dll. The DLLs’ functions imported matched the Windows API function names I found earlier in the strings. The functions provide the sample with the ability to: create and open files and directories, copies text from a window’s title bar, returns a handle to an active window, returns handle to a loaded module, and monitor for when a key is pressed. All of which strengthens the indication that the sample is in fact a keylogger.

Dynamic Analysis


The opposite of static analysis is dynamic analysis which is examining the malware as it runs on a system. There are different dynamic analysis steps and tools to use but I’m only going to discuss one; monitoring program execution with Capture-Bat. Below is the output from the Capture-Bat log after AdobeInfo.exe executed on the system (the entries related to my monitoring tools were removed).

"2/8/2012 15:03:27.653","process","created","C:\WINDOWS\explorer.exe","C:\Samples\AdobeInfo.exe"

"2/8/2012 15:03:40.403","file","Write","C:\Samples\AdobeInfo.exe","C:\Samples\mssvr\UpdaterInfo.dat"

"2/8/2012 15:03:40.481","file","Write","C:\Samples\AdobeInfo.exe","C:\Samples\mssvr\UpdaterInfo.dat"

"2/8/2012 15:03:40.497","file","Write","C:\Samples\AdobeInfo.exe","C:\Samples\mssvr\UpdaterInfo.dat"

"2/8/2012 15:04:33.419","file","Write","C:\Samples\AdobeInfo.exe","C:\Samples\mssvr\UpdaterInfo.dat"

"2/8/2012 15:04:33.419","file","Write","C:\Samples\AdobeInfo.exe","C:\Samples\mssvr\UpdaterInfo.dat"

Capture-Bat revealed when AdobeInfo.exe runs it creates a folder named mssvr in the same folder where the executable is located as well as creates a file named UpdaterInfo.dat inside the folder. Remember the suspicious strings before? Now the strings \UpdaterInfo.dat and \mssvr make a lot more sense. Looking at the UpdaterInfo.dat file closer showed it was a text file containing the captured data as can be seen in the partial output below.


---- 20120802 15:07:38 ----------------
15:07:40 The Active Windows Title: Process Explorer - Sysinternals: www.sysinternals.com [XP-SP2\Administrator]
15:07:33 The Active Windows Title: C:\WINDOWS\system32\cmd.exe
15:07:39 The Active Windows Title: Process Explorer - Sysinternals: www.sysinternals.com [XP-SP2\Administrator]
c[CTRL]y
15:07:41 The Active Windows Title: Process Monitor - Sysinternals: www.sysinternals.com
15:07:44 The Active Windows Title: Process Monitor
15:07:38 The Active Windows Title: Process Monitor
15:07:38 The Active Windows Title: API Monitor v2 (Alpha-r12) 32-bit (Administrator)
15:07:44 The Active Windows Title: Process Monitor
15:07:45 The Active Windows Title: API Monitor v2 (Alpha-r12) 32-bit (Administrator)
15:07:35 The Active Windows Title: ApateDNS


Everything in the analysis so far has identified the AdobeInfo.exe program as a keylogger that stores its captured data in a log file named UpdaterInfo.dat. All that was left was to confirm the functionality. I used Windows to create a password protected zip file then I unzipped it. A quick look at the UpdaterInfo.dat log file afterwards confirmed the functionality (note: Windows made me enter the password twice).


16:07:30 The Active Windows Title: Program Manager
16:07:38 The Active Windows Title: Add to Archive
[CTRL]
16:07:58 The Active Windows Title: Program Manager
supersecretsupersecret
16:07:58 The Active Windows Title: Compressing
16:07:59 The Active Windows Title: Program Manager
16:07:21 The Active Windows Title: Extraction Wizard
16:07:30 The Active Windows Title: Password needed
16:07:37 The Active Windows Title: Extraction Wizard
supersecret
16:07:40 The Active Windows Title: Program Manager
16:07:42 The Active Windows Title: Windows Explorer

Creating Custom AntiVirus Signature


I’m not going into detail about how to create custom signatures for ClamAV but I will point to the great references I found on the subject. The Malware Analyst’s Cookbook talks about how to leverage ClamAV for malware analysis in the recipes: Recipe 3-1 (examining existing ClamAV signatures), Recipe 3-2 (creating a custom ClamAV database), and Recipe 3-3 (converting ClamAV signatures to Yara). Another resource is Alexander Hanel’s post An Intro to Creating Anti-Virus Signatures. The ClamAV website also has information on the subject as well including the slide deck in PDF format for the webcast Writing CalmAV Signatures.

I spent some time creating different signatures: from a custom hash database to extended signature format to a logical signature. To keep the post shorter I’m only going to cover how I created a logical signature. A ClamAV logical signature is based on hex strings found inside a file and logical operators can be used to combine the hex strings in different ways. The format for the signature is below:

SignatureName;TargetDescriptionBlock;LogicalExpression;Sig0;Sig1;Sig2;

The SignatureName is self explanatory, the TargetDescriptionBlock is the type of file the signature applies to (0 means any file), LogicalExpression is how the signatures are combined using logical operators, and the Sig# are the actual hex strings. The completed signature is placed into a file with an ldb extension.

Reviewing the strings in AdobeInfo.exe provided some good candidates to create a signature for; specially \UpdaterInfo.dat, \mssvr, and [CTRL]. I used portable apps ClamAV’s sigtool to determine the hex of those strings. I ran the following command for each string:

C:\>echo \UpdaterInfo.dat | App\clamwin\bin\sigtool --hex-dump

The end result provided me with the hex for each string.

\UpdaterInfo.dat
5c55706461746572496e666f2e646174

\mssvr
5c6d73737672

[CTRL]
5b4354524c5d

I then combined the strings into a logical signature as shown next.

AdobeInfo.exe;Target:0;0&1&2;5c55706461746572496e666f2e646174;5c6d73737672;5b4354524c5d

Finally, I ran the custom signature against the AdobeInfo.exe file and was successfully able to identify it. The command to run a custom scan from the command-line in portable ClamAV is:

App\clamwin\bin\clamscan -d adobe.ldb C:\Samples\

Empowering the Help Desk


I’m done right? I was able to analyzing the malware to determine its functionality, create a custom antivirus signature to detect it, and found a way to run the custom signature using the portable apps ClamAv version. I wouldn’t be too quick to say my job is done though. Let’s be honest, going to any help desk and telling the staff from now on you have to use the command-line may not have the greatest chances of success. You need to provide options; one option most help desk staff will want is an antivirus program with a GUI that’s similar to their commercial antivirus programs. ClamAV has a pretty nice graphical user interface that can be configured to use custom signatures so we could leverage it.

The article How to create custom signatures for Immunet 3.0, powered by ClamAV explains how to write custom signatures and configure the Windows ClamAV version (Immunet) to use them. This is nice but Immunet has to be installed on a computer. A cool option would be to be able to run scans from a removable drive so when the help desk respond to a system all they need to do is to plug in their thumb drive. This is where the portable apps ClamAV version comes into play since it can run scans from a thumb drive. I couldn’t find any documentation about how to use custom signatures in the portable version but after a little testing I figured it out. All that has to be done is to copy the custom signature to the same folder where ClamAV stores it signature files main.cvd and daily.cdv. This location is ClamWinPortable\Data\db folder. I copied my adobe.ldb custom signature to the Data\db folder and was able to locate the malware sample I disguised as Notepad ++.


Linkz for Toolz

$
0
0
It looks like Santa put his developers to work so they could deliver an early Christmas for those wanting DFIR goodies. Day after day this week there was either a new tool being released or an updated version of an existing tool. In this Linkz edition there isn’t much commentary about the tools because I’m still working my way through testing them all to better understand: what the tool is, how the tool functions, and if the tool can benefit my DFIR process. Without further ado here are the Linkz of the DFIR goodies dropped in the past week.

Big shout out to Glen (twitter handle @hiddenillusion) for his steady stream of tweets from the 2012 Open Source Digital Forensics Conference saying what the new tool releases were.


RegRipper Plugins

The RegRipper project released a new archive containing a bunch of plugins. The plugins extract a wealth of information including: program execution artifacts (appcompatcache, direct, prefetch, and tracing), user account file access artifacts (shellbags), and a slew of plugins to create timeline data (appcompatcache_tln, applets_tln, networklist_tln, and userassist_tln). For the full detail about what was updated check out Wiki History page and to get the new archive go to the download section on the RegRipperPlugins Google code site.

ForensicScanner

While on the topic about a tool authored by Harlan, I might as well talk about his latest creation. Harlan released a new tool named Forensic Scanner followed by a detailed post explaining what the tool is. To get a better understanding about how to use the scanner there’s documentation on the Wiki page for ScannerUsage (there's also a user guide included in the zip file). What I find really cool about this tool is how it will speed up examinations. All one has to do is point the Forensic Scanner at a mounted image and then it extracts all information fairly quick. It reduces the time needed for extracting information so an analysis can start sooner; thus reducing the overall examination time. The tool is hosted on the download section of the ForensicScanner Google code site.

Volatility

Up next is another tool that is plugin based but this time around I’m pretty speechless. All I can say is the project has released a ton of information to accompany its latest version. Leading up to the release the project released a new plugin every day for a month and each plugin was accompanied with a blog post. Jamie Levy did an outstanding job summarizing all the blog posts: Week 1 of the Month of Volatility Plugins posted, Week 2 of the Month of Volatility Plugins posted, and Week 3 of the Month of Volatility Plugins posted. To grab the latest Volatility version go to the Google code site download section and to see what is new check out the Volatility 2.2 release notes.

Log2timeline

Another great tool has been updated but this time it’s a tool for performing timeline analysis. Log2timeline 0.65 was released a few weeks ago; I know this post is discussing tools released in the last week but I can’t do a toolz post and completely ignore L2T. One cool update is the addition of a new input module to parse utmp file which is an artifact on Linux that keeps track of user logins and logouts on the system. To grab Log2timeline 0.65 go to the Google code site download section and to see all the updates check out the Changelog.

L2T_Review

There are different ways to review the Log2timeline output data depending on the output’s format. Typically, people use the csv output and in this case a few different options were available. The csv file could be Grepped, viewed in a text editor, or examined with a spreadsheet program such as Microsoft Excel (refer to jIIr post Reviewing Timelines with Excel) or OpenOffice Calc (refer to jIIr post Reviewing Timelines with Calc). Now there’s another option and it’s a pretty good option at that. David Nides has been working on his L2T_review tool for reviewing log2timeline csv timelines. He posted about it a few times including here, here, and here. Typically, I don’t mention tools still in beta but I wanted to make an exception for this one. I finally got around to testing L2T_review this week and I definitely liked what I saw.

Sleuth Kit and Autopsy

The 2012 Open Source Digital Forensics Conference did occur this week so it shouldn’t be a surprise to see a new version of the Sleuth Kit released. I haven’t had the time to test out Sleuth Kit 4.0 nor have I been able to look into what the new updates are. Sleuthkit 4.0 can be downloaded from the Sleuth Kit website and the History page can be referenced to see what the updates are. The Autopsy Forensic Browser is a graphical interface to The Sleuth Kit and a new Windows beta version was released last month. I quickly tested out the functionality and I’m truly impressed. I’ve been looking for a decent free forensic browser besides FTK Imager to run on Windows and now I can say my search is over. Autopsy is that forensic browser and it can be downloaded from the Autopsy download page.

HexDive

I’ve mentioned the HexDive program on my blog a few times and the latest is when I was analyzing a keylogger. HexDive has been updated so it provides more context and testing out this new functionality is on my weekend to-do list.

ProcDOT

Speaking about malware analysis. I picked up on this next tool from a Lenny Zeltser tweet. ProDOT is “tool processes Sysinternals Process Monitor (Procmon) logfiles and PCAP-logs (Windump, Tcpdump) to generate a graph via the GraphViz suite”. This tool seems really cool by being able to correlate the ProcMon logfile with a packet capture to show how the activity looks. Yup, when I’m running HexDrive against a malware sample the follow up test will be to launch the malware and then see how the dynamic information looks with ProcDOT.

GRR Rapid Response

I first learned about GRR when I attended the SAN Digital Forensic and Incident Response summit last June. GRR Rapid Response is an incident response framework that can be used when responding to incidents. At the top of my to-do list when I have a decent amount of free time will be set up GRR in a lab environment to get a better understanding how the framework can benefit the IR process. The GRR homepage provides some overview information, the Wiki page provides a wealth of information, and the GRR Rapid Response - OSFC 2012.pdf slide deck contains information as well. GRR itself can be found on the download page.

Lightgrep is open source!

LightGrep is a tool to help perform fast searches. I have yet to try this software out but an interesting development is the core Lightgrep engine is now open source. This will be one to keep an eye on to see how it develops.

bulk_extractor

Rounding out this edition of Linkz for Toolz is a new version for the program bulk_extractor. Bulk_extractor scans a disk image, a file, or a directory of files and extracts useful information without parsing the file system or file system structures. Again, this is another tool on my to-do list to learn more about since my free time has been spent on improving my own processes using the tools already in my toolkit.
Viewing all 102 articles
Browse latest View live